
Welcome to the playoffs, Baby!
This year the schedule for the playoffs is a bit different than in years past, including starting with a brand new race at a track that’s never hosted more one race a season. Las Vegas Motor Speedway typically hosts the third race of the year, which it did this year, but the ownership group shifted the second race from New Hampshire to Vegas to give LVMS a second race weekend. NASCAR then scheduled it as the opener for the playoffs this year and thus we are here.
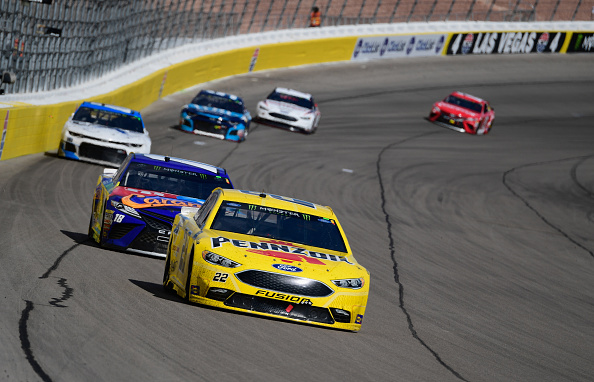
Vegas is a 1.5-mile track with the corners banked at 12-20 degrees in a fashion that gets steeper as you get closer to the outside wall. Despite being in the middle of a desert, the track surface isn’t terribly worn so tire wear and speed fall off isn’t a big issue at this track. Track position is a major factor here like it is at Kansas and Michigan which is why they were put into the similar tracks section on this track breakdown. Unlike those tracks however Vegas isn’t used to running a second Cup series race so there is some question as to how the surface and the cars will behave later in the year compared to earlier in the year. The average ambient temp in the area of Las Vegas is in the mid-to-upper-60s in March when the traditional race weekend is but in late-August and early-September the average temp is between 95-105 degrees which is a major difference, not just for the drivers and crew who have to work in the heat but also for the cars and track as things run differently in that kind of heat.
Based on the last four races here there are only five drivers with a +6 position differential here which doesn’t bode well for people moving up, however with the expected heat this weekend we could hear a lot of Dale Jr.’s tagline “slide job.” In the last 10 races, seven of the winners have come from the top-10 starting positions with the other three coming twice from P18 and once from P20. In fact in the 21 total races run at LVMS to this point only once has the winner come from the pole position (Kyle Busch in 2009) but four times from the second starting start including three of the last five and the last two races back-to-back.
There will be no points changes section this week since this race wasn’t run last year and with the potential changes I didn’t want to compare it to a race that wasn’t run at a similar time.
Track Data
Last Four Races at Las Vegas Motor Speedway
| Avg. | Avg. | Avg. | Top | Top | Top | Top | Laps | |||
| Driver | Races | Start | Run Pos. | Finish | Wins | 5s | 10s | 15s | 20s | Led |
| Kevin Harvick | 4 | 11.3 | 10.3 | 11.8 | 2 | 2 | 3 | 3 | 3 | 357 |
| Martin Truex Jr | 4 | 6 | 6.3 | 4.5 | 1 | 3 | 3 | 4 | 4 | 159 |
| Brad Keselowski | 4 | 6 | 6 | 4.8 | 1 | 2 | 4 | 4 | 4 | 122 |
| Joey Logano | 4 | 5 | 6 | 5.8 | 0 | 2 | 4 | 4 | 4 | 149 |
| Kyle Larson | 4 | 8 | 10.5 | 11.8 | 0 | 2 | 3 | 3 | 3 | 0 |
| Kyle Busch | 3 | 15 | 7 | 9.3 | 0 | 2 | 2 | 2 | 2 | 48 |
| Ryan Blaney | 4 | 12 | 10.8 | 9.3 | 0 | 1 | 3 | 3 | 4 | 1 |
| Denny Hamlin | 4 | 15.5 | 12.8 | 11.8 | 0 | 1 | 2 | 2 | 4 | 10 |
| Ryan Newman | 4 | 18.5 | 13.3 | 11 | 0 | 1 | 1 | 3 | 4 | 14 |
| Jimmie Johnson | 4 | 12.5 | 14 | 16.8 | 0 | 1 | 1 | 3 | 3 | 140 |
| Austin Dillon | 4 | 17 | 17 | 15.8 | 0 | 1 | 1 | 2 | 3 | 2 |
| Chase Elliott | 3 | 10.3 | 11.3 | 25 | 0 | 1 | 1 | 1 | 1 | 0 |
| Paul Menard | 4 | 16.3 | 15 | 13.8 | 0 | 0 | 1 | 3 | 4 | 0 |
| Jamie McMurray | 4 | 17.8 | 16.8 | 17.8 | 0 | 0 | 1 | 2 | 3 | 0 |
| Erik Jones | 2 | 8.5 | 10.5 | 11.5 | 0 | 0 | 1 | 2 | 2 | 0 |
| Aric Almirola | 4 | 20.3 | 20.5 | 18.5 | 0 | 0 | 1 | 2 | 2 | 0 |
| AJ Allmendinger | 4 | 21 | 22.8 | 18.5 | 0 | 0 | 1 | 2 | 2 | 0 |
| Clint Bowyer | 4 | 19.8 | 19.5 | 17.8 | 0 | 0 | 1 | 1 | 2 | 0 |
| Kurt Busch | 3 | 7 | 14.7 | 24.7 | 0 | 0 | 1 | 1 | 1 | 32 |
| Ricky Stenhouse Jr | 4 | 20.8 | 21 | 22 | 0 | 0 | 0 | 2 | 2 | 0 |
| Trevor Bayne | 4 | 26.8 | 21.5 | 19.5 | 0 | 0 | 0 | 1 | 3 | 1 |
| Chris Buescher | 3 | 26 | 26 | 21.3 | 0 | 0 | 0 | 1 | 1 | 0 |
| Michael McDowell | 4 | 25.8 | 28.3 | 28.5 | 0 | 0 | 0 | 0 | 1 | 13 |
| Regan Smith | 2 | 33.5 | 23 | 20.5 | 0 | 0 | 0 | 0 | 1 | 1 |
| Daniel Suarez | 2 | 14.5 | 22 | 23 | 0 | 0 | 0 | 0 | 1 | 0 |
| Alex Bowman | 2 | 23.5 | 28.5 | 29.5 | 0 | 0 | 0 | 0 | 1 | 0 |
| Ty Dillon | 2 | 27.5 | 24.5 | 22.5 | 0 | 0 | 0 | 0 | 0 | 2 |
| Bubba Wallace | 1 | 26 | 23 | 21 | 0 | 0 | 0 | 0 | 0 | 0 |
| Matt DiBenedetto | 3 | 32.3 | 29 | 26.3 | 0 | 0 | 0 | 0 | 0 | 0 |
| David Ragan | 4 | 24.8 | 29.3 | 26.5 | 0 | 0 | 0 | 0 | 0 | 0 |
| William Byron | 1 | 17 | 28 | 27 | 0 | 0 | 0 | 0 | 0 | 0 |
| Ross Chastain | 1 | 33 | 30 | 29 | 0 | 0 | 0 | 0 | 0 | 0 |
| Landon Cassill | 3 | 32 | 33 | 30 | 0 | 0 | 0 | 0 | 0 | 0 |
| Reed Sorenson | 1 | 37 | 34 | 31 | 0 | 0 | 0 | 0 | 0 | 0 |
| Jeffrey Earnhardt | 3 | 36.7 | 35 | 32 | 0 | 0 | 0 | 0 | 0 | 0 |
| JJ Yeley | 1 | 40 | 38 | 36 | 0 | 0 | 0 | 0 | 0 | 0 |
| Timmy Hill | 1 | 39 | 37 | 37 | 0 | 0 | 0 | 0 | 0 | 0 |
| Corey LaJoie | 1 | 34 | 38 | 39 | 0 | 0 | 0 | 0 | 0 | 0 |
| BJ McLeod | 0 | 0 | 0 | 0 | 0 | 0 | 0 | 0 | 0 | 0 |
| Kyle Weatherman | 0 | 0 | 0 | 0 | 0 | 0 | 0 | 0 | 0 | 0 |
| Fast | Top 15 | Laps | Avg. | High | Low | Pos | Laps Led | High to | Low to | |
| Driver | Laps | Rate | Comp. | Rating | Rating | Rating | Diff | Pts./Race | Avg Rating | Avg Rating |
| Kevin Harvick | 166 | 80% | 869 | 115.7 | 150 | 62.2 | -0.50 | 22.31 | 34.3 | 53.5 |
| Martin Truex Jr | 94 | 95% | 1068 | 116.7 | 147.6 | 88.9 | 1.50 | 9.94 | 30.9 | 27.8 |
| Brad Keselowski | 119 | 93% | 1068 | 114 | 127.5 | 102.8 | 1.20 | 7.63 | 13.5 | 11.2 |
| Joey Logano | 83 | 96% | 1068 | 111.8 | 130.6 | 102.6 | -0.80 | 9.31 | 18.8 | 9.2 |
| Kyle Larson | 22 | 79% | 1063 | 96.4 | 117.1 | 53.3 | -3.80 | 0.00 | 20.7 | 43.1 |
| Kyle Busch | 43 | 91% | 801 | 103.6 | 110 | 97.3 | 5.70 | 4.00 | 6.4 | 6.3 |
| Ryan Blaney | 29 | 73% | 1067 | 95.3 | 114.3 | 63 | 2.70 | 0.06 | 19 | 32.3 |
| Denny Hamlin | 14 | 69% | 1066 | 86.9 | 108.7 | 74.3 | 3.70 | 0.63 | 21.8 | 12.6 |
| Ryan Newman | 13 | 69% | 1067 | 84.1 | 103.4 | 75.6 | 7.50 | 0.88 | 19.3 | 8.5 |
| Jimmie Johnson | 108 | 62% | 1036 | 97.1 | 130.3 | 68.6 | -4.30 | 8.75 | 33.2 | 28.5 |
| Austin Dillon | 7 | 45% | 1064 | 79.2 | 104.4 | 63.1 | 1.20 | 0.13 | 25.2 | 16.1 |
| Chase Elliott | 23 | 83% | 674 | 91.7 | 116.3 | 76.5 | -14.70 | 0.00 | 24.6 | 15.2 |
| Paul Menard | 10 | 52% | 1068 | 77.8 | 89.6 | 64.2 | 2.50 | 0.00 | 11.8 | 13.6 |
| Jamie McMurray | 5 | 51% | 977 | 73.6 | 86.9 | 58.8 | 0.00 | 0.00 | 13.3 | 14.8 |
| Erik Jones | 13 | 96% | 534 | 90.7 | 90.8 | 90.5 | -3.00 | 0.00 | 0.1 | 0.2 |
| Aric Almirola | 2 | 30% | 1063 | 70.5 | 79.4 | 61 | 1.80 | 0.00 | 8.9 | 9.5 |
| AJ Allmendinger | 19 | 26% | 1062 | 63.2 | 94.1 | 36.6 | 2.50 | 0.00 | 30.9 | 26.6 |
| Clint Bowyer | 1 | 28% | 1064 | 65.7 | 75.8 | 51.2 | 2.00 | 0.00 | 10.1 | 14.5 |
| Kurt Busch | 21 | 60% | 713 | 79.8 | 93.3 | 67.7 | -17.70 | 2.67 | 13.5 | 12.1 |
| Ricky Stenhouse Jr | 2 | 22% | 1057 | 66.3 | 81.8 | 53.7 | -1.20 | 0.00 | 15.5 | 12.6 |
| Trevor Bayne | 0 | 14% | 1062 | 61.4 | 75.5 | 51.1 | 7.30 | 0.06 | 14.1 | 10.3 |
| Chris Buescher | 5 | 6% | 797 | 53.8 | 59.6 | 48.4 | 4.70 | 0.00 | 5.8 | 5.4 |
| Michael McDowell | 8 | 3% | 897 | 47.5 | 57.2 | 42.2 | -2.70 | 0.81 | 9.7 | 5.3 |
| Regan Smith | 2 | 14% | 532 | 56.6 | 70.3 | 42.8 | 13.00 | 0.13 | 13.7 | 13.8 |
| Daniel Suarez | 3 | 5% | 530 | 57.9 | 60 | 55.7 | -8.50 | 0.00 | 2.1 | 2.2 |
| Alex Bowman | 9 | 15% | 293 | 50.1 | 64.5 | 35.7 | -6.00 | 0.00 | 14.4 | 14.4 |
| Ty Dillon | 0 | 1% | 531 | 50.1 | 58.2 | 42 | 5.00 | 0.25 | 8.1 | 8.1 |
| Bubba Wallace | 0 | 0% | 264 | 55.7 | 55.7 | 55.7 | 5.00 | 0.00 | 0 | 0 |
| Matt DiBenedetto | 2 | 1% | 792 | 43.3 | 49 | 35.8 | 6.00 | 0.00 | 5.7 | 7.5 |
| David Ragan | 5 | 2% | 1055 | 43.8 | 53.8 | 31.7 | -1.70 | 0.00 | 10 | 12.1 |
| William Byron | 1 | 4% | 263 | 48.4 | 48.4 | 48.4 | -10.00 | 0.00 | 0 | 0 |
| Ross Chastain | 0 | 3% | 262 | 35.7 | 35.7 | 35.7 | 4.00 | 0.00 | 0 | 0 |
| Landon Cassill | 1 | 0% | 791 | 38.9 | 45.4 | 32.6 | 2.00 | 0.00 | 6.5 | 6.3 |
| Reed Sorenson | 0 | 0% | 262 | 34.7 | 34.7 | 34.7 | 6.00 | 0.00 | 0 | 0 |
| Jeffrey Earnhardt | 0 | 0% | 778 | 30.2 | 32.3 | 28.7 | 4.70 | 0.00 | 2.1 | 1.5 |
| JJ Yeley | 0 | 0% | 260 | 32.4 | 32.4 | 32.4 | 4.00 | 0.00 | 0 | 0 |
| Timmy Hill | 0 | 0% | 135 | 27.5 | 27.5 | 27.5 | 2.00 | 0.00 | ||
| Corey LaJoie | 0 | 0% | 16 | 24.3 | 24.3 | 24.3 | -5.00 | 0.00 | 0 | 0 |
| BJ McLeod | 0 | 0% | 0 | 0 | 0 | 0 | 0.00 | 0 | 0 | |
| Kyle Weatherman | 0 | 0% | 0 | 0 | 0 | 0 | 0.00 | 0 | 0 |
Last 10 Races at Las Vegas Motor Speedway
| Avg. | Avg. | Avg. | Top | Top | Top | Top | Laps | |||
| Driver | Races | Start | Run Pos. | Finish | Wins | 5s | 10s | 15s | 20s | Led |
| Brad Keselowski | 10 | 9.6 | 13.7 | 14.5 | 2 | 4 | 6 | 6 | 6 | 188 |
| Kevin Harvick | 10 | 14.1 | 10.2 | 13.9 | 2 | 3 | 5 | 7 | 8 | 395 |
| Kyle Busch | 9 | 10.1 | 10.4 | 13.3 | 1 | 4 | 4 | 6 | 6 | 179 |
| Martin Truex Jr | 10 | 12.6 | 10.2 | 11.5 | 1 | 3 | 5 | 7 | 9 | 162 |
| Jimmie Johnson | 10 | 10.1 | 9.9 | 12.2 | 1 | 3 | 5 | 7 | 8 | 385 |
| Joey Logano | 10 | 8.2 | 10.6 | 9.7 | 0 | 3 | 6 | 8 | 9 | 194 |
| Ryan Newman | 10 | 13.3 | 14.1 | 14.1 | 0 | 3 | 4 | 6 | 8 | 14 |
| Kyle Larson | 5 | 9.8 | 12.4 | 13.2 | 0 | 2 | 3 | 3 | 4 | 0 |
| Paul Menard | 10 | 20.9 | 14.5 | 13.9 | 0 | 1 | 4 | 7 | 9 | 9 |
| Clint Bowyer | 10 | 16.7 | 17.5 | 15.2 | 0 | 1 | 4 | 5 | 6 | 16 |
| Denny Hamlin | 10 | 19 | 15.3 | 14.2 | 0 | 1 | 3 | 5 | 9 | 14 |
| Ryan Blaney | 4 | 12 | 10.8 | 9.3 | 0 | 1 | 3 | 3 | 4 | 1 |
| Austin Dillon | 6 | 16.5 | 17.3 | 16.7 | 0 | 1 | 1 | 2 | 4 | 2 |
| Chase Elliott | 3 | 10.3 | 11.3 | 25 | 0 | 1 | 1 | 1 | 1 | 0 |
| Jamie McMurray | 10 | 19.3 | 17.4 | 17.7 | 0 | 0 | 3 | 6 | 7 | 2 |
| Fast | Top 15 | Laps | Avg. | High | Low | Pos. | Laps Led | Rating | |
| Driver | Laps | Rate | Comp. | Rating | Rating | Rating | Diff. | Pts/Race | Range |
| Brad Keselowski | 177 | 65% | 2612 | 92.4 | 134.6 | 27.5 | -4.90 | 4.70 | 107.1 |
| Kevin Harvick | 240 | 76% | 2459 | 105.3 | 150 | 62.2 | 0.20 | 9.88 | 87.8 |
| Kyle Busch | 102 | 77% | 2260 | 100.6 | 118.5 | 74.1 | -3.20 | 4.97 | 44.4 |
| Martin Truex Jr | 111 | 79% | 2684 | 99.2 | 147.6 | 52.7 | 1.10 | 4.05 | 94.9 |
| Jimmie Johnson | 305 | 74% | 2655 | 107.6 | 130.3 | 68.6 | -2.10 | 9.63 | 61.7 |
| Joey Logano | 119 | 76% | 2687 | 97.3 | 130.6 | 73.9 | -1.50 | 4.85 | 56.7 |
| Ryan Newman | 25 | 63% | 2652 | 82.9 | 103.4 | 59.8 | -0.80 | 0.35 | 43.6 |
| Kyle Larson | 29 | 68% | 1329 | 92.5 | 117.1 | 53.3 | -3.40 | 0.00 | 63.8 |
| Paul Menard | 44 | 59% | 2672 | 81.9 | 108.1 | 57.1 | 7.00 | 0.23 | 51 |
| Clint Bowyer | 12 | 45% | 2681 | 74.1 | 93.6 | 51.2 | 1.50 | 0.40 | 42.4 |
| Denny Hamlin | 19 | 51% | 2685 | 79.9 | 108.7 | 61.7 | 4.80 | 0.35 | 47 |
| Ryan Blaney | 29 | 73% | 1067 | 95.3 | 114.3 | 63 | 2.70 | 0.06 | 51.3 |
| Austin Dillon | 8 | 41% | 1597 | 77.7 | 104.4 | 63.1 | -0.20 | 0.08 | 41.3 |
| Chase Elliott | 23 | 83% | 674 | 91.7 | 116.3 | 76.5 | -14.70 | 0.00 | 39.8 |
| Jamie McMurray | 14 | 50% | 2587 | 74.8 | 94.8 | 51.7 | 1.60 | 0.05 | 43.1 |
Last 21 Races at Similar Tracks (LVMS, Kansas, and Michigan)
| Avg. | Avg. | Avg. | Top | Top | Top | Top | Laps | |||
| Driver | Races | Start | Run Pos. | Finish | Wins | 5s | 10s | 15s | 20s | Led |
| Kevin Harvick | 21 | 9.1 | 7.1 | 8.7 | 5 | 12 | 15 | 18 | 19 | 863 |
| Martin Truex Jr | 21 | 7.7 | 7.8 | 8.8 | 3 | 8 | 11 | 18 | 21 | 795 |
| Kyle Larson | 19 | 14.3 | 12.7 | 15.2 | 3 | 7 | 9 | 11 | 13 | 245 |
| Joey Logano | 21 | 7 | 9.6 | 10.9 | 2 | 9 | 15 | 16 | 17 | 438 |
| Brad Keselowski | 21 | 8.4 | 9.2 | 9.8 | 2 | 8 | 15 | 17 | 19 | 412 |
| Kyle Busch | 19 | 8 | 9.5 | 10.3 | 1 | 9 | 13 | 15 | 16 | 453 |
| Jimmie Johnson | 21 | 14.5 | 12.9 | 14.2 | 1 | 5 | 9 | 12 | 17 | 344 |
| Clint Bowyer | 21 | 18.4 | 18.4 | 21 | 1 | 1 | 4 | 6 | 9 | 15 |
| Ryan Blaney | 17 | 11.1 | 9.6 | 12.1 | 0 | 6 | 10 | 12 | 14 | 156 |
| Denny Hamlin | 21 | 9.1 | 11.6 | 14.7 | 0 | 6 | 9 | 13 | 17 | 49 |
| Chase Elliott | 14 | 11.6 | 12.4 | 13.7 | 0 | 5 | 9 | 10 | 10 | 70 |
| Kurt Busch | 20 | 12 | 13.3 | 14.4 | 0 | 3 | 9 | 13 | 16 | 102 |
| Ryan Newman | 21 | 14.5 | 15.1 | 15.6 | 0 | 3 | 7 | 14 | 16 | 28 |
| Austin Dillon | 20 | 15.7 | 16.6 | 15.1 | 0 | 3 | 7 | 10 | 15 | 33 |
| Paul Menard | 21 | 19.4 | 17 | 16.7 | 0 | 2 | 6 | 10 | 17 | 17 |
| Fast | Top 15 | Laps | Avg. | High | Low | Pos | Laps Led | Rating | |
| Driver | Laps | Rate | Comp. | Rating | Rating | Rating | Diff. | Pts./Race | Range |
| Kevin Harvick | 616 | 88% | 4699 | 116.7 | 150 | 62.2 | 0.40 | 10.27 | 87.8 |
| Martin Truex Jr | 543 | 88% | 5074 | 109.8 | 147.6 | 75 | -1.10 | 9.46 | 72.6 |
| Kyle Larson | 215 | 70% | 4320 | 95.5 | 140.5 | 53.3 | -0.90 | 3.22 | 87.2 |
| Joey Logano | 248 | 81% | 4845 | 101.4 | 149.2 | 59.3 | -3.90 | 5.21 | 89.9 |
| Brad Keselowski | 319 | 88% | 4990 | 103.6 | 134.6 | 66.9 | -1.40 | 4.90 | 67.7 |
| Kyle Busch | 299 | 82% | 4320 | 103.5 | 129.8 | 62.8 | -2.30 | 5.96 | 67 |
| Jimmie Johnson | 344 | 64% | 1158 | 92.6 | 130.3 | 60.1 | 0.30 | 4.10 | 70.2 |
| Clint Bowyer | 32 | 42% | 3237 | 72 | 124.2 | 47.4 | -2.60 | 0.18 | 76.8 |
| Ryan Blaney | 156 | 79% | 3984 | 97.3 | 128.4 | 63 | -1.00 | 2.29 | 65.4 |
| Denny Hamlin | 69 | 76% | 2242 | 89.1 | 108.7 | 63.2 | -5.60 | 0.58 | 45.5 |
| Chase Elliott | 135 | 74% | 1058 | 94.4 | 126.5 | 73.1 | -2.10 | 1.25 | 53.4 |
| Kurt Busch | 69 | 62% | 4391 | 87.8 | 124.8 | 62.9 | -2.40 | 1.28 | 61.9 |
| Ryan Newman | 20 | 59% | 4850 | 80 | 103.4 | 49 | -1.10 | 0.33 | 54.4 |
| Austin Dillon | 49 | 48% | 4685 | 79.1 | 112.3 | 43.3 | 0.60 | 0.41 | 69 |
| Paul Menard | 51 | 48% | 4865 | 75.5 | 108.1 | 47.3 | 2.70 | 0.20 | 60.8 |
Momentum
| Avg. | Avg. | Avg. | Top | Top | Top | Top | Pos | Avg. | |||
| Driver | Races | Start | Run Pos. | Finish | Wins | 5s | 10s | 15s | 20s | Diff. | Rating |
| Brad Keselowski | 5 | 13 | 10.8 | 7.4 | 2 | 3 | 3 | 3 | 5 | 5.6 | 96.6 |
| Kevin Harvick | 5 | 9.6 | 8.8 | 5.8 | 1 | 3 | 5 | 5 | 5 | 3.8 | 113.4 |
| Chase Elliott | 5 | 9.6 | 8.2 | 6.6 | 1 | 3 | 4 | 5 | 5 | 3 | 112.5 |
| Kurt Busch | 5 | 14 | 9.2 | 5.6 | 1 | 1 | 5 | 5 | 5 | 8.4 | 103.9 |
| Erik Jones | 5 | 9.4 | 9.4 | 6.6 | 0 | 3 | 4 | 5 | 5 | 2.8 | 99.5 |
| Kyle Busch | 5 | 2.6 | 9.6 | 8.2 | 0 | 2 | 4 | 4 | 5 | -5.6 | 108 |
| Kyle Larson | 5 | 6.4 | 8.6 | 8.4 | 0 | 2 | 3 | 4 | 5 | -2 | 105.9 |
| Joey Logano | 5 | 9.4 | 14.8 | 13.2 | 0 | 2 | 3 | 4 | 4 | -3.8 | 85.4 |
| Denny Hamlin | 5 | 4 | 9.2 | 9.6 | 0 | 1 | 3 | 5 | 5 | -5.6 | 98.1 |
| Ryan Blaney | 5 | 11.8 | 10.4 | 10 | 0 | 1 | 2 | 5 | 5 | 1.8 | 97 |
| Clint Bowyer | 5 | 15 | 10 | 14 | 0 | 1 | 2 | 4 | 4 | 1 | 99.8 |
| Martin Truex Jr | 5 | 6.8 | 15.2 | 19.4 | 0 | 1 | 1 | 3 | 3 | -12.6 | 89.6 |
| Daniel Suarez | 5 | 23.6 | 17.4 | 16 | 0 | 1 | 1 | 2 | 4 | 7.6 | 77.1 |
| Austin Dillon | 5 | 16.6 | 15.2 | 16.4 | 0 | 1 | 1 | 2 | 3 | 0.2 | 75.2 |
| Jamie McMurray | 5 | 20.2 | 16.2 | 14.6 | 0 | 0 | 3 | 3 | 3 | 5.6 | 79.6 |
Top-10 and Bottom-10 Value Drivers
DraftKings
| Rank | Driver | Value | Rank | Driver | Value |
|---|---|---|---|---|---|
| 1 | Kevin Harvick | 5.73 | 40 | Kyle Weatherman | 2.08 |
| 2 | Regan Smith | 5.64 | 39 | BJ McLeod | 2.61 |
| 3 | Kyle Busch | 5.06 | 38 | Corey Lajoie | 2.79 |
| 4 | Clint Bowyer | 5.06 | 37 | Reed Sorenson | 2.79 |
| 5 | Kurt Busch | 4.81 | 36 | Timmy Hill | 2.82 |
| 6 | Aric Almirola | 4.63 | 35 | Trevor Bayne | 3.00 |
| 7 | Martin Truex Jr | 4.56 | 34 | Jamie McMurray | 3.09 |
| 8 | Joey Logano | 4.26 | 33 | William Byron | 3.17 |
| 9 | Austin Dillon | 4.16 | 32 | Ryan Newman | 3.35 |
| 10 | Chase Elliott | 4.04 | 31 | Paul Menard | 3.36 |
FanDuel
| Rank | Driver | Value | Rank | Driver | Value |
|---|---|---|---|---|---|
| 1 | Ross Chastain | 9.93 | 40 | Brad Keselowski | 4.01 |
| 2 | J.J. Yeley | 9.38 | 39 | Martin Truex Jr. | 4.25 |
| 3 | Landon Cassill | 8.32 | 38 | Kyle Larson | 4.46 |
| 4 | David Ragan | 8.16 | 37 | Kevin Harvick | 4.50 |
| 5 | Matt DiBenedetto | 8.06 | 36 | Ryan Blaney | 4.54 |
| 6 | Kyle Weatherman | 7.96 | 35 | Kyle Busch | 4.59 |
| 7 | Jeffrey Earnhardt | 7.90 | 34 | Joey Logano | 4.68 |
| 8 | Timmy Hill | 7.42 | 33 | Denny Hamlin | 4.86 |
| 9 | Bubba Wallace | 7.36 | 32 | Kurt Busch | 5.05 |
| 10 | Ricky Stenhouse Jr. | 7.31 | 31 | Austin Dillon | 5.08 |
Drivers To Watch This Week
Kevin Harvick: Harvick won here earlier this season as part of his three-straight wins to start the year. In the last four races he has two total wins, two top-fives, three top-10s, 357 laps led, and 166 fastest laps. That record is hard to top in that span and in the last 10 here he’s finished in the top-10 half the time and led nearly 400 laps. The driver of the 4-car is still hot coming into the playoffs with five straight top-10 finishes which makes him a high priced option this week, just like nearly every week this year.
Martin Truex Jr.: Truex has fallen a bit behind the other two members of the big three but that doesn’t mean he can’t strike for his fifth win of the season at any time, especially with his track record, excuse the pun, here. He has a win, three top-fives, three top-10s, 159 laps led, and 94 fastest laps in the last four races at LVMS. He is one of only four drivers to complete every lap or finish on the lead lap in each of the last four races and with that comes a 95% top-15 rate which is second in the field by just one percentage point. Being relatively less expensive than the two other big three drivers benefits you with picking him this week.
Brad Keselowski: If I told you that Keselowski was the best driver here over the last 10 races would you be surprised? His two wins, four top-fives, and six top-10s are either the best or tied for the best over that span. One of those wins came in the last four, with two top-fives, and one of only two drivers with four top-10s in the last most recent bunch of races. Nearly equal totals in laps led and fastest laps (122 to 119) shows he is capable of running up front and fast with the latter being the second best tally in the field. Keselowski is a better price on DK than FD at just $9,600 versus $12,600 and that’s attractive for a guy with his history here and having two straight wins coming into the playoffs.
Kyle and Kurt Busch: The home track of the Busch brothers has been surprising barren of wins by them. Only once in the 21 race history of the track as one of them won the race with Kyle bringing home the honors in 2009. Over their last three races each, Kyle has two top-fives, and one finish outside the top-20 with 48 laps led and 43 fastest laps, while Kurt has just one top-10 and 32 laps led and an average finish 17.7 spots worse than where he starts. That’s not the kind of history you would expect them to have at their home track. However this race has never been run with this much on the line and both Kurt and Kyle are both looking good coming into the race with nine combined top-10s in 10 combined races to finish out the regular season.
Joey Logano: Like his teammate, Logano runs very well here pretty much every time they unload at the Vegas track. In fact the two Penske drivers are the only ones in the field with top-10s in each of the last four races run here. Penske is also on a bit of a roll right now having won the last two races of the regular season and Logano finishing second at Darlington. If you pair that with him having the best average finish in the last 10 race (9.7) and having six top-10s and three top-fives in that time, Logano is another strong play this week.
Jimmie Johnson: It’s playoff time and Johnson has made it yet again, despite not having a win this year and not having run well much of the year. Now that Vegas is in the Chase, it adds another track that is good for Johnson historically into the fold. JJ has won four of the 21 races run here including three in a row at one point. He may only have one top-five and three top-15s in the last four but he has 140 laps led and 108 fastest laps and the sixth highest average rating in the field at 97.1. In the last 10 trips to the 1.5 mile layout he has a win, three top-fives, five top-10s, 385 laps led (good for second in the field), and 305 fastest laps (best in the field) and the second best average finish. If he can muster the mojo that’s led him to seven championships, he could be a contender this weekend, plus he does well in the heat thanks to his conditioning.