DFS NASCAR: Big Machine Vodka Brickyard 400 Track Breakdown

**UPDATE: Kasey Kahne (#95 car) will not race on Sunday due to complications from Heat Exhuastion and Regan Smith will instead drive the #95 car. He has not yet been added to the salary list on either site. I have updated the drivers to watch section to cover someone other than Kahne. You can simply ignore his data in the Track Data section.**
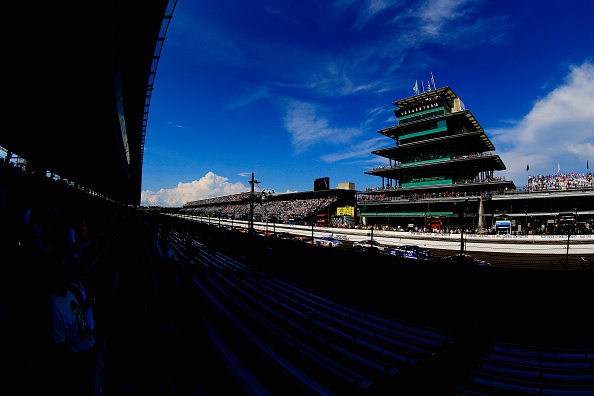
Aside from Daytona, this might just be the most historic race track the NASCAR schedule visits during the season. The “Brickyard” is a rectangular oval that is 2.5 miles in length for one lap and has four separate turns that are banked at a 9.2 degree angle with completely flat straightaways. The history is well established but this is the first time in a while that this race is happening this late in the year, since typically it happens in July and not as the last regular season race.
While it is typically considered a fairly hard track to pass on with 15 of the 24 total winners at the track coming from the top-10 starting spots, the last few years have had a myriad of cautions that have really blown up the position differential stats in that time. There have been 9, 8, and 14 cautions each of the last three races from earliest to last year, which for a race that is 160 laps long, that’s quite a few. With a bunch of guys still needing a win to sneak into the playoffs, that number could stay right around there this year since guys will be more likely to try and pull off risky moves.
With the track being so long in length, it also reduces the amount of laps led one guy tends to have, unless that guy is Kyle Busch who has straight dominated this track the last several races as he has three times more laps led than the next closest driver. A reduction in bonus points for laps led and fastest laps ( 120 total points available on DK and 96 between laps led and laps completed on FD), the key to a high scoring lineup is the guys that move up through the field. The similar track(s) this week is Pocono Raceway since it has similarly banked turns and is the same distance as Indy.
Track Data
Last Four Races at Indianapolis Motor Speedway
| Avg. | Avg. | Avg. | Top | Top | Top | Top | Laps | |||
| Driver | Races | Start | Run Pos. | Finish | Wins | 5s | 10s | 15s | 20s | Led |
| Kyle Busch | 4 | 5.8 | 6.5 | 9.5 | 2 | 3 | 3 | 3 | 3 | 255 |
| Kasey Kahne | 4 | 20.5 | 13.3 | 12.3 | 1 | 1 | 2 | 2 | 3 | 82 |
| Joey Logano | 4 | 8 | 8 | 4.5 | 0 | 3 | 4 | 4 | 4 | 44 |
| Matt Kenseth | 4 | 17 | 9 | 4.5 | 0 | 3 | 4 | 4 | 4 | 21 |
| Denny Hamlin | 4 | 13.3 | 10.5 | 7.3 | 0 | 3 | 3 | 3 | 4 | 18 |
| Kevin Harvick | 4 | 4 | 6 | 5.8 | 0 | 1 | 4 | 4 | 4 | 87 |
| Kyle Larson | 4 | 13.8 | 10 | 12.3 | 0 | 1 | 3 | 3 | 3 | 5 |
| Brad Keselowski | 4 | 12.5 | 12 | 10.3 | 0 | 1 | 2 | 3 | 4 | 55 |
| Martin Truex Jr | 4 | 13 | 11.8 | 17.5 | 0 | 1 | 2 | 2 | 2 | 8 |
| Ryan Newman | 4 | 15.3 | 15.8 | 14 | 0 | 1 | 1 | 3 | 3 | 0 |
| Jimmie Johnson | 4 | 10 | 12.3 | 14.8 | 0 | 1 | 1 | 3 | 3 | 0 |
| Austin Dillon | 4 | 18.5 | 17.8 | 16.3 | 0 | 0 | 2 | 2 | 2 | 1 |
| Paul Menard | 4 | 20 | 21.8 | 18.5 | 0 | 0 | 1 | 2 | 3 | 0 |
| Chris Buescher | 2 | 24 | 23 | 11.5 | 0 | 0 | 1 | 2 | 2 | 0 |
| Clint Bowyer | 4 | 18 | 16.3 | 18.3 | 0 | 0 | 1 | 1 | 2 | 3 |
| Kurt Busch | 4 | 11 | 16.3 | 20.3 | 0 | 0 | 1 | 1 | 2 | 0 |
| AJ Allmendinger | 4 | 31.5 | 27.3 | 22.3 | 0 | 0 | 1 | 1 | 2 | 0 |
| Daniel Suarez | 1 | 15 | 16 | 7 | 0 | 0 | 1 | 1 | 1 | 0 |
| Matt DiBenedetto | 3 | 32.3 | 33 | 26.7 | 0 | 0 | 1 | 1 | 1 | 0 |
| Jamie McMurray | 4 | 11.5 | 14.5 | 17.5 | 0 | 0 | 0 | 1 | 4 | 0 |
| Chase Elliott | 3 | 19.7 | 24.3 | 24 | 0 | 0 | 0 | 1 | 2 | 0 |
| Ryan Blaney | 3 | 19 | 15.3 | 23.7 | 0 | 0 | 0 | 1 | 1 | 6 |
| Aric Almirola | 4 | 30.3 | 24.5 | 24.3 | 0 | 0 | 0 | 1 | 1 | 0 |
| Ricky Stenhouse Jr | 4 | 21.8 | 22.8 | 26.5 | 0 | 0 | 0 | 1 | 1 | 0 |
| Timmy Hill | 2 | 39.5 | 37.5 | 27.5 | 0 | 0 | 0 | 1 | 1 | 0 |
| Ty Dillon | 1 | 28 | 21 | 19 | 0 | 0 | 0 | 0 | 1 | 0 |
| Michael McDowell | 4 | 27.8 | 27.3 | 24.5 | 0 | 0 | 0 | 0 | 1 | 0 |
| Landon Cassill | 4 | 31.3 | 27.8 | 24.5 | 0 | 0 | 0 | 0 | 1 | 0 |
| Erik Jones | 1 | 9 | 15 | 31 | 0 | 0 | 0 | 0 | 0 | 10 |
| David Ragan | 4 | 24.8 | 28.3 | 32.8 | 0 | 0 | 0 | 0 | 0 | 5 |
| Gray Gaulding | 1 | 35 | 30 | 24 | 0 | 0 | 0 | 0 | 0 | 0 |
| Jeffrey Earnhardt | 1 | 36 | 32 | 26 | 0 | 0 | 0 | 0 | 0 | 0 |
| BJ McLeod | 1 | 40 | 36 | 32 | 0 | 0 | 0 | 0 | 0 | 0 |
| Reed Sorenson | 2 | 40.5 | 38 | 35.5 | 0 | 0 | 0 | 0 | 0 | 0 |
| JJ Yeley | 2 | 35.5 | 37 | 38 | 0 | 0 | 0 | 0 | 0 | 0 |
| Corey LaJoie | 1 | 32 | 39 | 40 | 0 | 0 | 0 | 0 | 0 | 0 |
| Alex Bowman | 2 | 35 | 38 | 41.5 | 0 | 0 | 0 | 0 | 0 | 0 |
| Bubba Wallace | 0 | 0 | 0 | 0 | 0 | 0 | 0 | 0 | 0 | 0 |
| David Starr | 0 | 0 | 0 | 0 | 0 | 0 | 0 | 0 | 0 | 0 |
| Ross Chastain | 0 | 0 | 0 | 0 | 0 | 0 | 0 | 0 | 0 | 0 |
| William Byron | 0 | 0 | 0 | 0 | 0 | 0 | 0 | 0 | 0 | 0 |
| Fast | Top 15 | Laps | Avg. | High | Low | Pos | Laps Led | High to | Low to | |
| Driver | Laps | Rate | Comp. | Rating | Rating | Rating | Diff | Pts./Race | Avg Rating | Avg Rating |
| Kyle Busch | 140 | 87% | 604 | 130.3 | 150 | 116.8 | -3.70 | 15.94 | 19.7 | 13.5 |
| Kasey Kahne | 27 | 52% | 661 | 91.6 | 132.7 | 69.3 | 8.20 | 5.13 | 41.1 | 22.3 |
| Joey Logano | 15 | 90% | 661 | 106.7 | 117.9 | 99.5 | 3.50 | 2.75 | 11.2 | 7.2 |
| Matt Kenseth | 30 | 88% | 661 | 107.8 | 114 | 100.6 | 12.50 | 1.31 | 6.2 | 7.2 |
| Denny Hamlin | 18 | 79% | 660 | 97.9 | 109.4 | 81.3 | 6.00 | 1.13 | 11.5 | 16.6 |
| Kevin Harvick | 44 | 94% | 661 | 115.5 | 135.5 | 102.7 | -1.80 | 5.44 | 20 | 12.8 |
| Kyle Larson | 6 | 88% | 648 | 96.8 | 107.3 | 72.8 | 1.50 | 0.31 | 10.5 | 24 |
| Brad Keselowski | 15 | 70% | 661 | 94.7 | 102.8 | 85.3 | 2.20 | 3.44 | 8.1 | 9.4 |
| Martin Truex Jr | 33 | 69% | 604 | 96.9 | 114.5 | 66.7 | -4.50 | 0.50 | 17.6 | 30.2 |
| Ryan Newman | 2 | 55% | 657 | 79.3 | 88.9 | 70 | 1.30 | 0.00 | 9.6 | 9.3 |
| Jimmie Johnson | 9 | 69% | 652 | 89.6 | 97.1 | 78.2 | -4.80 | 0.00 | 7.5 | 11.4 |
| Austin Dillon | 8 | 46% | 656 | 74.9 | 89.7 | 60 | 2.20 | 0.06 | 14.8 | 14.9 |
| Paul Menard | 0 | 26% | 659 | 67.5 | 79.5 | 47 | 1.50 | 0.00 | 12 | 20.5 |
| Chris Buescher | 1 | 5% | 337 | 70 | 73.3 | 66.6 | 12.50 | 0.00 | 3.3 | 3.4 |
| Clint Bowyer | 2 | 52% | 641 | 79.6 | 88.5 | 54.3 | -0.30 | 0.19 | 8.9 | 25.3 |
| Kurt Busch | 5 | 62% | 642 | 81.1 | 91.7 | 69.7 | -9.30 | 0.00 | 10.6 | 11.4 |
| AJ Allmendinger | 1 | 4% | 562 | 56 | 64 | 43.2 | 9.20 | 0.00 | 8 | 12.8 |
| Daniel Suarez | 1 | 56% | 167 | 81 | 81 | 81 | 8.00 | 0.00 | 0 | 0 |
| Matt DiBenedetto | 0 | 5% | 333 | 39.7 | 61.8 | 23.2 | 5.60 | 0.00 | 22.1 | 16.5 |
| Jamie McMurray | 3 | 58% | 661 | 80.1 | 97.5 | 73.3 | -6.00 | 0.00 | 17.4 | 6.8 |
| Chase Elliott | 8 | 21% | 377 | 59.3 | 73.8 | 38 | -4.30 | 0.00 | 14.5 | 21.3 |
| Ryan Blaney | 7 | 49% | 478 | 76.8 | 92.6 | 63.5 | -4.70 | 0.50 | 15.8 | 13.3 |
| Aric Almirola | 2 | 12% | 656 | 59.8 | 67.7 | 46.8 | 6.00 | 0.00 | 7.9 | 13 |
| Ricky Stenhouse Jr | 1 | 17% | 597 | 61.7 | 69.7 | 53.5 | -4.70 | 0.00 | 8 | 8.2 |
| Timmy Hill | 0 | 1% | 278 | 36 | 47.2 | 24.7 | 12.00 | 0.00 | 11.2 | 11.3 |
| Ty Dillon | 0 | 21% | 165 | 59.5 | 59.5 | 59.5 | 9.00 | 0.00 | 0 | 0 |
| Michael McDowell | 0 | 7% | 656 | 52.8 | 63.8 | 43.7 | 3.30 | 0.00 | 11 | 9.1 |
| Landon Cassill | 0 | 6% | 653 | 48.8 | 57.2 | 41.1 | 6.80 | 0.00 | 8.4 | 7.7 |
| Erik Jones | 1 | 57% | 148 | 79 | 79 | 79 | -22.00 | 2.50 | 0 | 0 |
| David Ragan | 6 | 16% | 495 | 48.1 | 86 | 32.5 | -8.00 | 0.31 | 37.9 | 15.6 |
| Gray Gaulding | 0 | 0% | 162 | 41.8 | 41.8 | 41.8 | 11.00 | 0.00 | 0 | 0 |
| Jeffrey Earnhardt | 0 | 0% | 162 | 38.5 | 38.5 | 38.5 | 10.00 | 0.00 | 0 | 0 |
| BJ McLeod | 0 | 0% | 135 | 31 | 31 | 31 | 8.00 | 0.00 | 0 | 0 |
| Reed Sorenson | 0 | 0% | 321 | 30.6 | 31.3 | 29.9 | 5.00 | 0.00 | 0.7 | 0.7 |
| JJ Yeley | 0 | 0% | 230 | 30.2 | 32.5 | 27.8 | -2.50 | 0.00 | 2.3 | 2.4 |
| Corey LaJoie | 0 | 0% | 9 | 24.8 | 24.8 | 24.8 | -8.00 | 0.00 | 0 | 0 |
| Alex Bowman | 0 | 0% | 234 | 27.3 | 29.7 | 24.8 | -6.50 | 0.00 | ||
| Bubba Wallace | 0 | 0% | 0 | 0 | 0 | 0 | 0.00 | 0 | 0 | |
| David Starr | 0 | 0% | 0 | 0 | 0 | 0 | 0.00 | 0 | 0 | |
| Ross Chastain | 0 | 0% | 0 | 0 | 0 | 0 | 0.00 | 0 | 0 | |
| William Byron | 0 | 0% | 0 | 0 | 0 | 0 | 0.00 | 0 | 0 |
Top-15 Drivers Over Last 10 Races at Indianapolis
| Avg. | Avg. | Avg. | Top | Top | Top | Top | Laps | |||
| Driver | Races | Start | Run Pos. | Finish | Wins | 5s | 10s | 15s | 20s | Led |
| Jimmie Johnson | 10 | 7 | 8.5 | 10.5 | 3 | 5 | 5 | 7 | 8 | 269 |
| Kyle Busch | 10 | 14 | 10.5 | 12.1 | 2 | 4 | 7 | 8 | 8 | 272 |
| Kasey Kahne | 10 | 14.2 | 12.1 | 10.9 | 1 | 2 | 5 | 7 | 9 | 130 |
| Ryan Newman | 10 | 12.1 | 15.6 | 12 | 1 | 2 | 3 | 8 | 9 | 45 |
| Jamie McMurray | 10 | 13.2 | 15.1 | 13.9 | 1 | 2 | 3 | 5 | 8 | 26 |
| Paul Menard | 10 | 21.7 | 21.9 | 18.5 | 1 | 1 | 2 | 6 | 7 | 22 |
| Matt Kenseth | 10 | 14.8 | 12.1 | 12.3 | 0 | 5 | 7 | 8 | 8 | 32 |
| Denny Hamlin | 10 | 12.7 | 14.6 | 13.2 | 0 | 4 | 5 | 6 | 8 | 75 |
| Joey Logano | 9 | 13.1 | 12.8 | 11.7 | 0 | 3 | 6 | 7 | 7 | 55 |
| Kevin Harvick | 10 | 13.2 | 12.9 | 11.1 | 0 | 2 | 6 | 8 | 9 | 94 |
| Brad Keselowski | 8 | 12.5 | 13.8 | 12.4 | 0 | 1 | 4 | 5 | 7 | 99 |
| Martin Truex Jr | 10 | 18.7 | 14.5 | 18 | 0 | 1 | 3 | 4 | 5 | 11 |
| Kyle Larson | 4 | 13.8 | 10 | 12.3 | 0 | 1 | 3 | 3 | 3 | 5 |
| Clint Bowyer | 10 | 20.4 | 15.7 | 16.2 | 0 | 1 | 2 | 4 | 8 | 6 |
| Kurt Busch | 10 | 12.8 | 19.2 | 22.9 | 0 | 0 | 2 | 3 | 4 | 0 |
| Fast | Top 15 | Laps | Avg. | High | Low | Pos. | Laps Led | Rating | |
| Driver | Laps | Rate | Comp. | Rating | Rating | Rating | Diff. | Pts/Race | Range |
| Jimmie Johnson | 162 | 80% | 1612 | 109.8 | 150 | 75.9 | -3.50 | 6.73 | 74.1 |
| Kyle Busch | 176 | 79% | 1516 | 109.5 | 150 | 68.5 | 1.90 | 6.80 | 81.5 |
| Kasey Kahne | 76 | 68% | 1621 | 96.1 | 132.7 | 69.3 | 3.30 | 3.25 | 63.4 |
| Ryan Newman | 29 | 52% | 1617 | 85 | 134.2 | 62.2 | 0.10 | 1.13 | 72 |
| Jamie McMurray | 16 | 53% | 1621 | 82.8 | 127.6 | 57 | -0.70 | 0.65 | 70.6 |
| Paul Menard | 2 | 32% | 1575 | 68.9 | 104 | 24.8 | 3.20 | 0.55 | 79.2 |
| Matt Kenseth | 39 | 79% | 1577 | 97.5 | 119.1 | 68.7 | 2.50 | 0.80 | 50.4 |
| Denny Hamlin | 49 | 62% | 1604 | 91.4 | 119.5 | 69.6 | -0.50 | 1.88 | 49.9 |
| Joey Logano | 22 | 64% | 1445 | 91.2 | 117.9 | 61.5 | 1.40 | 1.53 | 56.4 |
| Kevin Harvick | 50 | 67% | 1609 | 94.8 | 135.5 | 39.3 | 2.10 | 2.35 | 96.2 |
| Brad Keselowski | 44 | 59% | 1301 | 89.3 | 102.8 | 64 | 0.10 | 3.09 | 38.8 |
| Martin Truex Jr | 36 | 55% | 1563 | 85.3 | 114.5 | 61.7 | 0.70 | 0.28 | 52.8 |
| Kyle Larson | 6 | 88% | 648 | 96.8 | 107.3 | 72.8 | 1.50 | 0.31 | 34.5 |
| Clint Bowyer | 11 | 51% | 1601 | 81.4 | 114.5 | 54.3 | 4.20 | 0.15 | 60.2 |
| Kurt Busch | 11 | 53% | 1526 | 75.6 | 96.5 | 42.7 | -10.10 | 0.00 | 53.8 |
Top-15 Drivers Over Last 20 Races at Similar Tracks
| Avg. | Avg. | Avg. | Top | Top | Top | Top | Laps | |||
| Driver | Races | Start | Run Pos. | Finish | Wins | 5s | 10s | 15s | 20s | Led |
| Kyle Busch | 20 | 11.4 | 10.6 | 13 | 4 | 7 | 13 | 15 | 15 | 534 |
| Jimmie Johnson | 20 | 12 | 12.4 | 15.3 | 3 | 6 | 9 | 11 | 14 | 276 |
| Martin Truex Jr | 20 | 13.7 | 14 | 16.2 | 2 | 4 | 8 | 10 | 13 | 197 |
| Matt Kenseth | 20 | 14.3 | 13.9 | 13.4 | 1 | 6 | 12 | 14 | 16 | 77 |
| Kurt Busch | 20 | 10.1 | 15.9 | 17.2 | 1 | 4 | 8 | 11 | 13 | 91 |
| Kasey Kahne | 20 | 17.2 | 15.4 | 17.5 | 1 | 2 | 7 | 12 | 14 | 132 |
| Ryan Newman | 20 | 12.9 | 15.8 | 14.1 | 1 | 2 | 6 | 15 | 16 | 46 |
| Jamie McMurray | 20 | 12.7 | 15.2 | 15.7 | 1 | 2 | 6 | 10 | 16 | 27 |
| Ryan Blaney | 9 | 14.7 | 14.4 | 15.7 | 1 | 1 | 3 | 6 | 6 | 27 |
| Paul Menard | 20 | 21.1 | 22.7 | 21.3 | 1 | 1 | 2 | 8 | 11 | 22 |
| Chris Buescher | 8 | 22.5 | 24.6 | 18.8 | 1 | 1 | 2 | 3 | 5 | 12 |
| Kevin Harvick | 20 | 11 | 11.6 | 9.8 | 0 | 9 | 14 | 17 | 18 | 276 |
| Brad Keselowski | 18 | 9.3 | 12.3 | 11.2 | 0 | 8 | 11 | 12 | 15 | 233 |
| Denny Hamlin | 20 | 10.4 | 12.3 | 13 | 0 | 6 | 11 | 14 | 16 | 105 |
| Joey Logano | 19 | 11 | 13.2 | 15.7 | 0 | 6 | 10 | 11 | 12 | 237 |
| Fast | Top 15 | Laps | Avg. | High | Low | Pos | Laps Led | Rating | |
| Driver | Laps | Rate | Comp. | Rating | Rating | Rating | Diff. | Pts./Race | Range |
| Kyle Busch | 340 | 79% | 2950 | 106.4 | 150 | 43 | -1.60 | 6.68 | 107 |
| Jimmie Johnson | 179 | 69% | 2942 | 97.1 | 150 | 45.3 | -3.30 | 3.45 | 104.7 |
| Martin Truex Jr | 186 | 59% | 3073 | 90.9 | 147 | 61.3 | -2.50 | 2.46 | 85.7 |
| Matt Kenseth | 74 | 67% | 3115 | 90.9 | 123.6 | 52.6 | 0.90 | 0.96 | 71 |
| Kurt Busch | 85 | 62% | 3098 | 87.6 | 128.6 | 42.7 | -7.10 | 1.14 | 85.9 |
| Kasey Kahne | 97 | 60% | 2966 | 83.9 | 132.7 | 23.7 | -0.30 | 1.65 | 109 |
| Ryan Newman | 31 | 52% | 3179 | 81.2 | 134.2 | 62.2 | -1.20 | 0.58 | 72 |
| Jamie McMurray | 24 | 56% | 3137 | 82 | 127.6 | 57 | -3.00 | 0.34 | 70.6 |
| Ryan Blaney | 24 | 61% | 1418 | 85.3 | 105.6 | 63.5 | -1.00 | 0.75 | 42.1 |
| Paul Menard | 10 | 27% | 3093 | 66 | 104 | 24.8 | -0.20 | 0.28 | 79.2 |
| Chris Buescher | 4 | 8% | 1236 | 60.5 | 76.2 | 49.6 | 3.70 | 0.38 | 26.6 |
| Kevin Harvick | 266 | 73% | 3051 | 103.5 | 141.4 | 39.3 | 1.20 | 3.45 | 102.1 |
| Brad Keselowski | 158 | 68% | 2839 | 96 | 143.3 | 64 | -1.90 | 3.24 | 79.3 |
| Denny Hamlin | 80 | 71% | 3171 | 93.6 | 119.5 | 69.6 | -2.60 | 1.31 | 49.9 |
| Joey Logano | 79 | 62% | 2993 | 91.1 | 128.7 | 61.5 | -4.70 | 3.12 | 67.2 |
Momentum
| Avg. | Avg. | Avg. | Top | Top | Top | Top | Pos | Avg. | |||
| Driver | Races | Start | Run Pos. | Finish | Wins | 5s | 10s | 15s | 20s | Diff. | Rating |
| Chase Elliott | 5 | 8.6 | 7.2 | 5 | 1 | 3 | 5 | 5 | 5 | 3.6 | 117.2 |
| Kevin Harvick | 5 | 15 | 8.4 | 5.8 | 1 | 3 | 5 | 5 | 5 | 9.2 | 115.5 |
| Kyle Busch | 5 | 8 | 9 | 6.8 | 1 | 3 | 4 | 4 | 5 | 1.2 | 112.6 |
| Brad Keselowski | 5 | 12.6 | 12.2 | 14.8 | 1 | 2 | 2 | 2 | 4 | -2.2 | 92.3 |
| Kurt Busch | 5 | 14.6 | 10.4 | 6.2 | 1 | 1 | 5 | 5 | 5 | 8.4 | 99.9 |
| Erik Jones | 5 | 7.4 | 8.4 | 7.2 | 0 | 3 | 4 | 5 | 5 | 0.2 | 103 |
| Kyle Larson | 5 | 11.4 | 9.6 | 10.2 | 0 | 2 | 3 | 3 | 4 | 1.2 | 100 |
| Joey Logano | 5 | 14.4 | 16 | 15.8 | 0 | 2 | 3 | 3 | 3 | -1.4 | 83.2 |
| Daniel Suarez | 5 | 19.8 | 15.2 | 12.8 | 0 | 2 | 2 | 3 | 4 | 7 | 86 |
| Ryan Blaney | 5 | 16.6 | 11.2 | 10.2 | 0 | 1 | 2 | 5 | 5 | 6.4 | 94 |
| Alex Bowman | 5 | 13.6 | 15.8 | 13.4 | 0 | 1 | 2 | 3 | 4 | 0.2 | 82 |
| Martin Truex Jr | 5 | 7.8 | 10.6 | 14.4 | 0 | 1 | 1 | 4 | 4 | -6.6 | 98.8 |
| Austin Dillon | 5 | 20.4 | 15.4 | 14.6 | 0 | 1 | 1 | 3 | 4 | 5.8 | 75.5 |
| Denny Hamlin | 5 | 2.4 | 9.6 | 11 | 0 | 0 | 3 | 5 | 5 | -8.6 | 94 |
| Jamie McMurray | 5 | 17 | 16.6 | 17.2 | 0 | 0 | 2 | 2 | 3 | -0.2 | 76.9 |
Points Changes at Brickyard 400
DraftKings
| 17 Race | Season | DK Pts +/- | |
| Driver | Total | Avg DK Pts. | Season AVG |
| Kasey Kahne | 67.5 | 26.89 | 40.6 |
| Matt Kenseth | 61.75 | 21.33 | 40.4 |
| Timmy Hill | 53 | 12.69 | 40.3 |
| AJ Allmendinger | 63 | 24.92 | 38.1 |
| Matt DiBenedetto | 55 | 22.27 | 32.7 |
| Chris Buescher | 52 | 26.11 | 25.9 |
| Brad Keselowski | 56.75 | 33.14 | 23.6 |
| Ryan Newman | 46.5 | 24.9 | 21.6 |
| Daniel Suarez | 45.5 | 29.62 | 15.9 |
| Gray Gaulding | 31 | 16.11 | 14.9 |
| Landon Cassill | 31 | 18.86 | 12.1 |
| Aric Almirola | 50 | 38.48 | 11.5 |
| Ty Dillon | 34 | 22.89 | 11.1 |
| BJ McLeod | 20 | 10.67 | 9.3 |
| Jeffrey Earnhardt | 28 | 18.7 | 9.3 |
| Michael McDowell | 32 | 22.81 | 9.2 |
| Paul Menard | 29 | 24.02 | 5.0 |
| Joey Logano | 43 | 38.06 | 4.9 |
| Austin Dillon | 23.5 | 28.24 | -4.7 |
| Jamie McMurray | 18 | 23.36 | -5.4 |
| JJ Yeley | 3 | 16.43 | -13.4 |
| Corey LaJoie | -4 | 13.66 | -17.7 |
| Denny Hamlin | 15.5 | 37.82 | -22.3 |
| Ryan Blaney | 13 | 36.68 | -23.7 |
| David Ragan | -2 | 22.79 | -24.8 |
| Kyle Larson | 13.5 | 41.34 | -27.8 |
| Ricky Stenhouse Jr | -5 | 25.04 | -30.0 |
| Kevin Harvick | 36.5 | 67.45 | -31.0 |
| Jimmie Johnson | -6 | 31.7 | -37.7 |
| Clint Bowyer | 5.5 | 45.01 | -39.5 |
| Erik Jones | -8.5 | 32.63 | -41.1 |
| Kurt Busch | -2 | 40.65 | -42.7 |
| Kyle Busch | 18.75 | 62.96 | -44.2 |
| Martin Truex Jr | -6 | 48.05 | -54.1 |
| Chase Elliott | -18 | 38.43 | -56.4 |
| AVG. +/- | 25.2 |
FanDuel
| 17 Race | 18 Season | FD Pts +/- | |
| Driver | Total | Avg FD Pts. | Season AVG |
| Kasey Kahne | 69.9 | 44.95 | 24.95 |
| Timmy Hill | 55.2 | 30.38 | 24.82 |
| Matt Kenseth | 59.3 | 38.93 | 20.37 |
| AJ Allmendinger | 62.2 | 42.81 | 19.39 |
| Matt DiBenedetto | 59.2 | 41.42 | 17.78 |
| Brad Keselowski | 63.5 | 50.10 | 13.40 |
| Chris Buescher | 57.2 | 45.40 | 11.80 |
| Ryan Newman | 57.2 | 46.22 | 10.98 |
| Daniel Suarez | 54.7 | 47.78 | 6.92 |
| Gray Gaulding | 38.7 | 34.73 | 3.97 |
| Michael McDowell | 42.6 | 39.07 | 3.53 |
| Landon Cassill | 39.7 | 38.01 | 1.69 |
| Jeffrey Earnhardt | 36.2 | 36.35 | -0.15 |
| Ty Dillon | 43 | 43.44 | -0.44 |
| Aric Almirola | 52.7 | 53.92 | -1.22 |
| Joey Logano | 55.2 | 56.69 | -1.49 |
| Paul Menard | 42.2 | 44.40 | -2.20 |
| BJ McLeod | 26.5 | 28.82 | -2.32 |
| Jamie McMurray | 36.7 | 45.52 | -8.82 |
| Austin Dillon | 35.7 | 48.80 | -13.10 |
| Kevin Harvick | 49.7 | 64.27 | -14.57 |
| Denny Hamlin | 34.6 | 54.63 | -20.03 |
| Ryan Blaney | 28.3 | 50.07 | -21.77 |
| Kyle Larson | 26.9 | 55.89 | -28.99 |
| JJ Yeley | 9 | 38.35 | -29.35 |
| Corey LaJoie | -2.1 | 27.78 | -29.88 |
| Jimmie Johnson | 18.3 | 49.00 | -30.70 |
| Clint Bowyer | 20.8 | 57.27 | -36.47 |
| Kurt Busch | 18.4 | 55.16 | -36.76 |
| Ricky Stenhouse Jr | 9.6 | 46.55 | -36.95 |
| Erik Jones | 13.8 | 52.51 | -38.71 |
| David Ragan | 4.6 | 44.46 | -39.86 |
| Martin Truex Jr | 6.3 | 57.77 | -51.47 |
| Kyle Busch | 10.2 | 63.89 | -53.69 |
| Chase Elliott | -5.2 | 54.46 | -59.66 |
| AVG. +/- | 20.52 |
Top-10 and Bottom-10 Value Drivers
DraftKings
| Rank | Driver | Value | Rank | Driver | Value |
|---|---|---|---|---|---|
| 1 | Kevin Harvick | 5.53 | 40 | BJ McLeod | 2.27 |
| 2 | Kyle Busch | 5.38 | 39 | Reed Sorenson | 2.57 |
| 3 | Clint Bowyer | 5.00 | 38 | Corey Lajoie | 2.68 |
| 4 | Aric Almirola | 4.81 | 37 | Timmy Hill | 2.76 |
| 5 | Martin Truex Jr | 4.76 | 36 | Jamie McMurray | 2.96 |
| 6 | Kurt Busch | 4.62 | 35 | Matt Kenseth | 3.05 |
| 7 | Joey Logano | 4.43 | 34 | William Byron | 3.36 |
| 8 | Chase Elliott | 4.18 | 33 | Brad Keselowski | 3.38 |
| 9 | David Ragan | 4.14 | 32 | JJ Yeley | 3.42 |
| 10 | Matt DiBenedetto | 4.12 | 31 | Ricky Stenhouse Jr | 3.43 |
FanDuel
| Rank | Driver | Value | Rank | Driver | Value |
|---|---|---|---|---|---|
| 1 | J.J. Yeley | 9.59 | 40 | Brad Keselowski | 4.28 |
| 2 | Ross Chastain | 8.88 | 39 | Kyle Larson | 4.37 |
| 3 | Matt DiBenedetto | 8.28 | 38 | Joey Logano | 4.53 |
| 4 | Jeffrey Earnhardt | 8.08 | 37 | Kyle Busch | 4.56 |
| 5 | Michael McDowell | 7.81 | 36 | Kevin Harvick | 4.69 |
| 6 | Gray Gaulding | 7.72 | 35 | Martin Truex Jr. | 4.70 |
| 7 | Timmy Hill | 7.59 | 34 | Matt Kenseth | 4.75 |
| 8 | Ty Dillon | 7.24 | 33 | Denny Hamlin | 4.75 |
| 9 | B.J. McLeod | 7.21 | 32 | Chase Elliott | 4.86 |
| 10 | Ricky Stenhouse Jr. | 7.16 | 31 | Ryan Blaney | 5.11 |
Drivers To Watch This Week:
Jimmie Johnson: Johnson sits 15th in the playoff standings heading into this week and is +87 above the cut line which means a decent finish and he should be safe even if someone not currently in the playoffs wins. His history here is pretty solid as well with a top-five and three top-15s in the last four races with three wins, five top-fives, five top-10s, and 269 laps led in the last 10 races. He is getting tired of hearing about how they’ve struggled this year and most of last year as well, he could put that to bed with a strong performance on Sunday.
Alex Bowman: Bowman is just below his teammate and the man on the bubble heading into the season finale with a 68-point cushion. In his precious two Cup races here he hasn’t run well but that was in subpar equipment and certainly not anywhere close to what he’s piloting now. As long as no one new wins this week, or at least a new winner who isn’t in the playoffs, he should be advancing to the Chase field at Vegas next week. The last few weeks he has been showing good speed, and that should continue here.
Ricky Stenhouse Jr.: Stenhouse is the first man out of the playoffs right now and has a tough task ahead of him this week in trying to win to get in given his struggles here. Only one top-15 in the last four isn’t going to cut it this week but his crew chief has been known to pull late race strategy calls that wind up helping him. He is bottom mid-tier to low-tier salary guy on both sites, which is where he should be, but if he shows speed he might just be worth a flier.
Ryan Newman: Newman is an Indiana man and so winning again at the Brickyard would be not only big for him as a win at his home track but it would also put him into the playoff field. In the last four he has similar stats to JJ but in the last 10 he’s got a win, three top-10s, and eight top-15s with 45 laps led. Last year in Phoenix Newman’s crew chief made a late race call to stay out and that won him his one race win in the last few years, a similar call might be necessary this week, along with similar speed to what he showed at Darlington a week ago.
Daniel Suarez: It was before the Chicago race that Suarez guaranteed that he would make the playoffs and now this week is his last chance to make that guarantee hold true. He is 20th in the playoff standings and needs nothing short of a win to make the Chase being nearly 100 points on the outside. Suarez has two races here in the Xfinity and Cup series so far in his career and both races had the same finiish for him at P7. In the Cup series race last year he had a +8 position differntial which only ups his value. He is a mid-tier guy salary-wise on both sites this week and with him needing a win and nothing less to make the playoffs expect him to be aggressive on the restarts and with strategy calls to try and finish off the regular season with a win.