

Labeling a player as a "must-avoid" seems like painting with a broad brush. Just like suggesting recency bias affects players differently. Disappointments from 2019 like Rhys Hoskins , Khris Davis and Edwin Díaz own much different average draft positions (ADP) as a result while others get a pass. Why? Well, recency bias proves to be a fickle factor determining draft capital. Especially when a player owns an outlier career year which resonates in fantasy player’s minds. For instance, a player who launched 59 home runs in 2017 with a robust .281/.376/.631 slash line. Yes, Giancarlo Stanton , here’s looking at you.
Playing in a ballpark constructed to enhance his prodigious power potential, Stanton’s turned in a nice season for the Yankees but not like the one he owned in Miami. Injuries, sometimes freak ones, contribute to his missed games in the past but it needs to be baked into any projection or outlook on him for 2020. Before explaining the summation of this article, first, the facts. Since his debut in 2010, Stanton’s track record looks something like this from 2011 spanning nine seasons:
- Three seasons of 150 games played or more, four with 125 or fewer
- Five seasons of at least 30 home runs or more (each resulted in at least 34 or higher)
- One season over 40 home runs (2017)
- Two seasons scoring at least 100 runs, one with 89. His other six seasons, all below 80
- Three seasons of 100 RBI or more...zero others with more than 90
- One season with at least 600 at-bats, four with at least 500
- One season with a strikeout percentage below 25 percent. No other with lower than 26.6 percent
- Stanton’s hit over .280 in four seasons, but below .270 in five of them including below .250 twice
- There’s no doubt he can hit for power with five years of a .500 slugging percentage or better with three of them above .600
- He’s also an isolated power monster with a career .279 mark
However, without being privy to how “bouncy” the baseball will be in 2020, power flourished last year and will be available throughout any draft or auction. Even with migration to the mean, with stolen bases in decline and the fly ball revolution sparking a change in the approach of batters, chicks not only dig the long ball, they litter the landscape. So why does Stanton still own an average draft position in the top-60? Upside. His 85th-to-90th percentile season would make a run at the 2017 season drafters continue to chase despite his warts. No one wishes to know the best-looking person in the room cannot carry on a conversation, it’s easier to imagine what if they liked you.
As for Stanton, he strikes out often. His career 28.1 strikeout percentage and 14 percent swinging strike rate confirm it. Again, it’s cherry picking. However, similarly flawed players do not get the pass Stanton receives due to the 2017 season staring them in the eye. Remember chasing Jason Heyward ’s 2012 season with 27 home runs and 21 stolen bases. He never recorded at least 20 of each in any ensuing season. Back to our man Stanton. Steamer does not help keeping Stanton’s talent suppressed in a projection predicting he will blast 48 home runs with 115 RBI and a .268/.355/.589 slash line over 139 games. It’s possible. Tempering expectations a bit, THE BAT forecasts Stanton to hit 41 home runs with 98 RBI and a .259/.349/.542 slash line. Still solid but with lower expectations across the board.
Of course, Stanton’s also a Statcast hero with his numbers jumping off the page. Between the years of 2015-through-2019 he’s generated 1,351 batted ball events with 237 barrels (17.5 percent), an average exit velocity of 93.4 MPH, a 12.4 launch angle and a 48.5 hard hit percentage (batted balls with an exit velocity of 95 MPH or higher). His expected numbers align with an average closer to THE BAT’s projection with a .260 expected average on Statcast along with a .528 expected slugging and .371 expected weighted on-base average.
Before delving into Stanton’s ATC projection compared to his peers, here’s his numbers the last three full seasons taking out his career year from 2017:
- 2014: 14.7 BB%, 26.6 K%, 12.9 Swinging strike percentage, 69.6 contact rate, 81.8 Z-Contact
- 2016: 10.6 BB%, 29.8 K%, 15.2 Swinging strike percentage, 66.7 contact rate, 81.4 Z-Contact
- 2018: 9.9 BB%, 29.9 K%, 14.4 Swinging strike percentage, 67.8 contact rate, 80.5 Z-Contact
This averages out to 141 games, 523 at-bats, 82 runs, 34 home runs, 93 RBI, six stolen bases and a .266/.357/.519 slash line for this three year sample.
In an effort to differentiate between the two systems, using the ATC projection system which represents an aggregate projection, Stanton falls in the middle of his high and low tide projection sets. Of course, there’s the caveat of how many games will Stanton accrue in 2020. Plus, one cannot ignore his price. Since the inception of February in NFBC 12-team online drafts, Stanton’s the 55th player selected on average with a high pick of 35 and a low pick of 79, quite a range. Honestly, after pick 75, this could be a moot point. However, risk weighs in this decision. Taking Stanton at his present price point means passing over Matt Olson , a gaggle of starting pitchers or speed. Different strokes for different folks.
For clarity of the thought process, the value column weighs the counting statistics along with average in rotisserie scoring to arrive at a weighted number to differentiate a group of similar players. This set represents five potential power bats to target using the ATC projections:
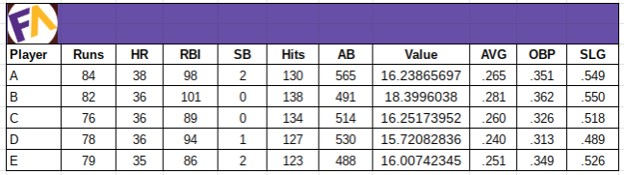
At first glance, it appears the player to own here would be Player B. Here’s each player with their respective average draft positions referenced about Stanton above:
- Player A: Giancarlo Stanton 55th overall 35-to-79 range
- Player B: Nelson Cruz 83rd overall 61-to-125 range
- Player C: Franmil Reyes 152nd overall 132-to-181 range
- Player D: Khris Davis 176th overall 155-to-200 range
- Player E: Kyle Schwarber 147th overall 127-to-177 range
Given the cost of Giancarlo Stanton compared to his peers in this sample, personally going to pass on spending a top-60 pick on what could be if everything goes his way. Can Stanton hit 40 or more home runs with a .268 average, sure. Will he? No idea. There are no guarantees in a draft, but knowing there’s at least four options representing pivot options means one can be pliable when targeting power, not forced to overpay. Especially when Jorge Soler , Michael Conforto , Miguel Sanó and others are not included but appear in the top-30 home runs projected by ATC. Cost versus potential productivity prices Stanton out of my range of outcomes. Feeling lucky?
--------------------------------------------------------------------------------------------------------
Statistical Credits:
Fangraphs.com
BaseballSavant.com
Steamerprojections.com
ATC courtesy of Ariel Cohen
THE BAT courtesy of Derek Carty