.jpg)

| Age: | 22 |
| Bats/Throws: | L/L |
| Height/Weight: | 6'4", 213 lbs |
| Position: | First Base |
Fueled by the memory of how Cody Bellinger rewarded savvy fantasy owners who stashed him last year, he’s riding the National League Rookie of the Year Award into the second round of most drafts. Bellinger launched 25 home runs in his first 70 games prior to the All-Star break with a similar slash line to his career minor league numbers.
However, trying to forecast his follow-up will be a bit more difficult. There’s much to like within Bellinger’s profile, he hits for power, generates fly balls with the tendency to pull the ball along with some pocket speed to stay relevant in all of the counting categories. In only 132 games last year, Bellinger scored 87 runs, hit 39 home runs, drove in 97 and swiped 10 bases.
Owning strong on-base tendencies in the minors should translate to Bellinger staying relevant. But where will his average settle in, how many home runs can owners expect this year and with a clear path to playing time, what’s a reasonable projection? All seem like burning questions. On the surface, it seems like a tale of two halves when looking at his surface numbers:
- Cody Bellinger 1H: 70 games, 257 at-bats, 50 runs, 25 home runs, 58 RBI, five stolen bases; .261/.342/.619
- Cody Bellinger 2H: 62 games, 223 at-bats, 37 runs, 14 home runs, 39 RBI, five stolen bases; .274/.363/.538
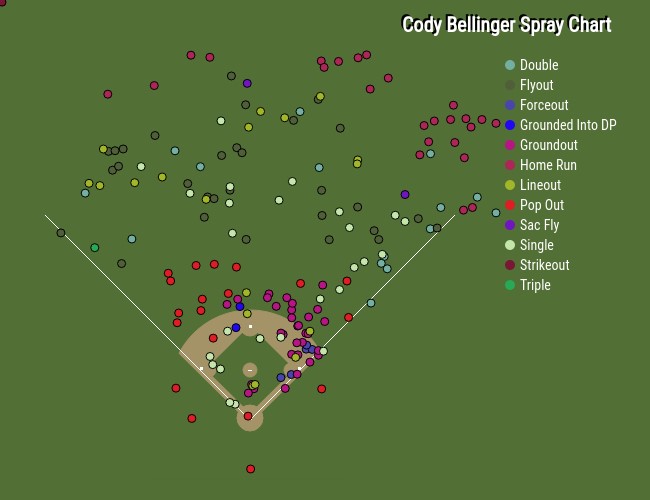
After his hot start, especially in terms of power, Bellinger seemed to settle in during the second half. Especially in regards to raising his average and on-base percentage but sacrificing some power along with way. Bellinger’s first half isolated power, .358 jumps off the page with his 48.8 fly ball percentage, 46.6 percent pull rate and unsustainable 30 percent home run per fly ball percentage. Here’s a look at his first half spray chart courtesy of MLBfarm.com:

Transitioning to his second half statistics, Bellinger did not trade much in the way of fly balls, finishing with a 45.3 percentage, but he did lose some line drives with an increase in ground balls to 38.4 percent. This affected his isolated power, decreasing to .265 after the break with his home run per fly ball percentage dropping to a more reasonable 19.4 percent. Of note, his hard hit rate went from 46.6 percent in the first half to 38 in the second. Here’s his same chart showing the second half:
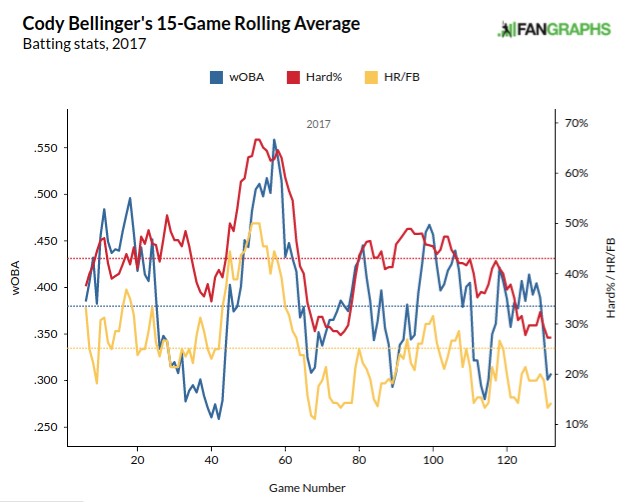
Did Bellinger trade some power for discipline or could his second half just be regression to the mean? Looking at his monthly splits, it could point to Bellinger being a much better roto player compared to head-to-head formats. Bellinger recorded three months with an average of .286 or better with a Weighted Runs Created Plus (wRC+) of 141 or higher. On the other hand, he also turned in three months with a .263 average or lower with an according wRC+ closer to the league average of 127 or lower. For an idea of how his season peaked with some valleys, here’s his 15-game rolling chart with weighted on-base average, home run per fly ball rate and hard-hit percentage:
Bellinger finished the season with a 69.6 contact percentage which ranked tied for seventh lowest among qualified hitters. There’s a price to be paid at times for power. According to Statcast, Bellinger hit a ball with an average exit velocity of 95 MPH or higher 44.2 percent of the time. He did not chase too much outside of the strike zone with a 27.4 percent rate but did finish with a swinging strike percentage of 13.2 on the season.
Shifting to his expected statistics from xSTATS, Bellinger should have hit .267/.352/.555 with an expected on-base average of 37.8 percent and 35.6 home runs. Not too much pull back on the power and his slash lines almost match. Factor in Bellinger’s average fly ball distance of 338 feet and the power should continue.
When looking at his projections, much of his counting statistics will rely on how many at-bats Bellinger accrues. Here’s a chart showing his forecast from three different samples:
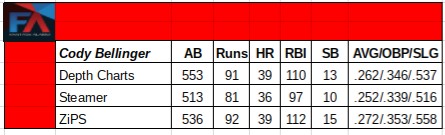
Taking into account his second half slash line (.274/.363/.538), it makes for a nice baseline. Of course, his xSTATS suggest .267 seems more realistic which places him in the middle of Depth Charts and ZiPS above and higher than Steamer. Taking the over on the at-bats, Bellinger should come closer to the 550 or more with a clear path to at-bats and his splits last year did not crater initially versus left-handed pitching.
Paying for 36 home runs seems tangible with double digit steals to accompany it. Just keep in mind it will take paying full price of his projections to roster him this season. If a sophomore slump occurs, some more consolidation could happen, but his prospect status should keep this from cratering totally. Not to mention the support of his lineup.
After all of this, Cody Bellinger makes for an interesting player to target. Perhaps a bit too rich for some tastes, but the allure of youth and upside will keep his average draft position at a premium.
--------------------------------------------------------------------------------------------------------------------------------
Statistical Credits:
Fangraphs.com, xSTATS.org, BaseballSavant.com, MLBfarm.com, Steamerprojections.com, Rosterresource.com, ZiPS courtesy of Dan Szymborski