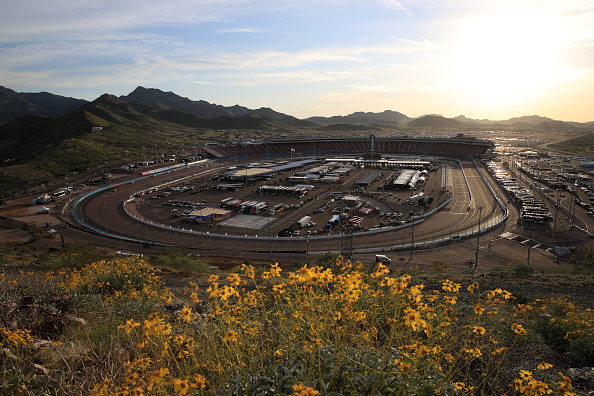
Phoenix is the host for this week’s race and its quirky 1-mile layout. What makes the layout unique is the “dogleg” portion of the straightaway right after the start/finish line that makes for a great passing zone and wild restarts. This year there should be more restarts than there were in last year’s two races at the track since the package has less downforce and therefore the cars are more inclined to slide around and be harder to keep out of trouble, or at least that’s the idea.
The 312 laps that make up the FanShield 500 will be clicked off quickly and there is a history of drivers starting in the front of the pack leading quite a few laps in the race making laps led a stat we’re going to want to focus on this week. Position differential is hard to come by with roughly the same amount of drivers going forward by as much as others go backward and so that’s the second stat we also want to focus on for both sites. There is also a new tire combination on the cars this week, along with the change in the aero package which should make it more imperative to save the tires as best as they can as there will be more fall off here than in the previous races. If you want a comparable package to this week go back to 2017-18 at Phoenix for this combo of horsepower and low downforce.
One other quick note is a side story that’s developing this week is that this track is the site of the championship race at the end of the year and so there are a few teams that will be experimenting with setups in the cars this week to see how it works and what changes they would need to make if they make it to the final four of the playoffs. The temps for Sunday’s race are also expected to be about 13 degrees cooler than they were on Friday for practice which will make the track have a bit more grip but as is usual in the desert, the temps will heat up quickly so the end of the race will have slicker conditions than the start of the race.
Points Scored by Starting Spot
As always, this table is a guide and not set in stone but it can help decide between a couple of different similar drivers for you.
Stacks
| {{stack.team.name}} | {{player.name}} |
 DraftKings DraftKings | {{player.fantasy.price.value[8]}}- |
| {{player.fantasy.price.value[6]}}- |

