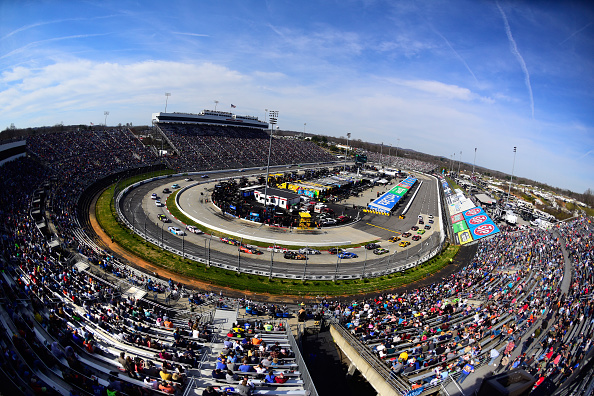
With tensions and stressors already peaking with four races left in the season, a return trip to Martinsville is sure to raise those even more with the beating and banging that happens on the smallest track on the Cup schedule. Known as the Paperclip, simply because it looks like one, it’s a flat track with the only banking really being on the outer grooves of turns. It also has a unique feature, for a unique track, in that there are actual curbs on the inside of the turns that keeps the inside groove from trying to go too far down in the groove.
A track this small brings in some interesting things to consider. Pit road is tricky and is actually in two parts and that makes pit selection highly important. Lapping happens often at tracks this small as half the field was at least one lap down in the March race when all was said and done and that doesn’t count the middle of the race when guys couldn’t get laps back on late-race cautions. The position differentials are a key stat to look at as those that can bump and run the best are the ones that have the best position differentials in the field. There are also crazy restarts on tracks this small with 36-40 cars packed into a very tight space and nowhere to go. Expect the late-race runs to be key to final finishing order as several past races have been decided in the last few corners with moves made to pass the leader.
Starting Spots of Past Winners
Starting Pos.
Races Won
Starting Pos.
Races Won
1
21
14
7
2
15
15
4
3
16
16
1
4
14
17
4
5
7
18
1
6
8
19
2
7
8
20
3
8
2
21
2
9
6
22
1
10
5
23
2
11
2
24
1
12
2
36
1
13
2
There have been 141 past Cup races at Martinsville and 73 of them have been won by those starting in the top-five starting spots with 21 Pole Winners winning the race, though the last one happened in 2013. Overall, 25 different spots have at least one winner and the furthest back was 36th. Every spot between first and 24th have won here as well but no one between 25th and 35th have registered a win.
Schedule of Events
This is a two-day show this week meaning both practices and qualifying are on Saturday morning for practices and afternoon for qualifying. The race is Sunday at 3 pm ET. Inspection should be Sunday morning meaning a first time fail loses the qualifying time and start in the rear, getting scored that way. The Podcast will be out Friday with the Playbook coming Saturday and the lineups being finalized Sunday morning.
*There is no Similar Track section this week since Martinsville doesn’t compare well to any other track or races.
Track Data
Drivers To Watch This Week:
Last Five First Data 500s
Avg.
Run
Avg.
Pos.
Top
Top
Top
Top
Driver
#
Start
Pos.
Finish
Diff.
W
5
10
15
20
Kyle Busch
5
7.6
5.6
5.2
2.4
1
4
4
5
5
Joey Logano
5
3.2
4.6
15.2
-12
1
2
3
3
3
Jimmie Johnson
5
17.8
15.4
13.8
4
1
1
1
4
4
Denny Hamlin
5
6.4
8.2
4.6
1.8
0
3
5
5
5
Brad Keselowski
5
10
8.8
14.8
-4.8
0
3
3
3
3
Martin Truex Jr
5
12.8
9.8
11.2
1.6
0
2
4
4
4
Ryan Newman
5
12.6
13
9.6
3
0
1
3
4
5
Kevin Harvick
5
18
14
15.2
2.8
0
1
3
3
4
Clint Bowyer
5
12.8
17.6
20.4
-7.6
0
1
2
2
2
Daniel Suarez
2
11.5
15
12
-0.5
0
0
1
2
2
Chase Elliott
3
9
9.3
15.3
-6.3
0
0
1
2
2
Ricky Stenhouse Jr
5
25.2
28.6
24.6
0.6
0
0
1
2
3
Avg.
Run
Avg.
Pos.
Top
Top
Top
Top
Driver
#
Start
Pos.
Finish
Diff.
W
5
10
15
20
Ryan Blaney
3
7.7
14
15.7
-8
0
0
1
1
3
David Ragan
5
27.2
26.6
23.6
3.6
0
0
1
1
2
Kurt Busch
5
13
11.2
24
-11
0
0
1
1
1
Aric Almirola
5
13.2
16.4
16.2
-3
0
0
0
2
4
Austin Dillon
5
26.2
19.8
18
8.2
0
0
0
2
4
Paul Menard
5
22.4
21.4
19.2
3.2
0
0
0
2
3
Chris Buescher
3
23.7
23.7
20.3
3.4
0
0
0
1
1
Ty Dillon
2
24.5
25
22.5
2
0
0
0
1
1
Kyle Larson
5
10.8
19.2
27.4
-16.6
0
0
0
1
2
Michael McDowell
3
23.3
24.3
20.7
2.6
0
0
0
0
2
Alex Bowman
3
29
26
22.7
6.3
0
0
0
0
1
Landon Cassill
5
30.6
28.4
24.8
5.8
0
0
0
0
1
Avg.
Run
Avg.
Pos.
Top
Top
Top
Top
Driver
#
Start
Pos.
Finish
Diff.
W
5
10
15
20
Erik Jones
2
14.5
24
26
-11.5
0
0
0
0
0
Ross Chastain
1
22
30
29
-7
0
0
0
0
0
JJ Yeley
3
39
36.7
33
6
0
0
0
0
0
Corey LaJoie
1
36
30
33
3
0
0
0
0
0
Bubba Wallace
1
37
30
34
3
0
0
0
0
0
Matt DiBenedetto
4
29.3
32
34.3
-5.5
0
0
0
0
0
Reed Sorenson
3
32.3
34.7
35
-2.7
0
0
0
0
0
Timmy Hill
3
41
40
38.7
2.3
0
0
0
0
0
William Byron
1
11
29
39
-28
0
0
0
0
0
Ryan Preece
1
37
35
42
-5
0
0
0
0
0
Daniel Hemric
0
0
0
0
0
0
0
0
0
0
Matt Tifft
0
0
0
0
0
0
0
0
0
0
Laps
Laps Led
Fastest
Fast Laps
Top-15
Avg. Driver
Driver
#
Led
/Race
Laps
/Race
Rate
Rating
Kyle Busch
5
287
57.4
155
31.0
98%
116
Joey Logano
5
656
131.2
205
41.0
97%
115.8
Jimmie Johnson
5
116
23.2
79
15.8
64%
91.5
Denny Hamlin
5
157
31.4
176
35.2
87%
108.9
Brad Keselowski
5
292
58.4
223
44.6
81%
103.2
Martin Truex Jr
5
192
38.4
130
26.0
78%
98.9
Ryan Newman
5
0
0.0
32
6.4
71%
88.5
Kevin Harvick
5
38
7.6
99
19.8
70%
89.5
Clint Bowyer
5
34
6.8
93
18.6
57%
82.7
Daniel Suarez
2
0
0.0
1
0.5
40%
81.1
Chase Elliott
3
123
41.0
75
25.0
87%
95.4
Ricky Stenhouse Jr
5
0
0.0
10
2.0
8%
52.4
Laps
Laps Led
Fastest
Fast Laps
Top-15
Avg. Driver
Driver
#
Led
/Race
Laps
/Race
Rate
Rating
Ryan Blaney
3
0
0.0
13
4.3
45%
81.6
David Ragan
5
0
0.0
24
4.8
11%
55
Kurt Busch
5
43
8.6
44
8.8
77%
87.2
Aric Almirola
5
0
0.0
20
4.0
42%
77.9
Austin Dillon
5
6
1.2
30
6.0
34%
71.1
Paul Menard
5
0
0.0
2
0.4
12%
64.1
Chris Buescher
3
0
0.0
1
0.3
9%
59.6
Ty Dillon
2
0
0.0
6
3.0
27%
55.4
Kyle Larson
5
6
1.2
19
3.8
40%
70.3
Michael McDowell
3
0
0.0
0
0.0
1%
55.4
Alex Bowman
3
0
0.0
12
4.0
7%
55.5
Landon Cassill
5
0
0.0
36
7.2
2%
48.3
Laps
Laps Led
Fastest
Fast Laps
Top-15
Avg. Driver
Driver
#
Led
/Race
Laps
/Race
Rate
Rating
Erik Jones
2
0
0.0
1
0.5
16%
62.5
Ross Chastain
1
0
0.0
0
0.0
0%
42.9
JJ Yeley
3
0
0.0
3
1.0
0%
33.7
Corey LaJoie
1
0
0.0
0
0.0
2%
39.7
Bubba Wallace
1
0
0.0
0
0.0
0%
39.4
Matt DiBenedetto
4
0
0.0
16
2.5
0%
40.1
Reed Sorenson
3
0
0.0
1
0.3
0%
35.1
Timmy Hill
3
0
0.0
3
1.0
0%
27.1
William Byron
1
0
0.0
2
2.0
8%
52.8
Ryan Preece
1
0
0.0
0
0.0
0%
37.2
Daniel Hemric
0
0
0
0
0
0
0
Matt Tifft
0
0
0
0
0
0
0
Top-20 Drivers Over Last 10 Martinsville Races
Avg.
Run
Avg.
Pos.
Top
Top
Top
Top
Driver
#
Start
Pos.
Finish
Diff.
W
5
10
15
20
Kyle Busch
9
7.8
4.8
3.8
4
2
8
8
9
9
Brad Keselowski
10
8.4
7
9.3
-0.9
2
7
8
8
8
Denny Hamlin
10
7.8
10.1
11
-3.2
1
5
7
8
8
Joey Logano
10
2.7
7.5
11.9
-9.2
1
4
6
7
8
Clint Bowyer
10
15.1
15.4
15.5
-0.4
1
2
5
6
6
Jimmie Johnson
10
16.4
15.6
16.7
-0.3
1
1
2
7
7
Martin Truex Jr
10
9.5
9.4
10.8
-1.3
0
3
7
7
9
Kevin Harvick
10
14.7
11
13.2
1.5
0
2
6
6
9
Chase Elliott
8
11.8
13.5
14.8
-3
0
2
4
5
6
Ryan Blaney
7
9.1
11.4
14
-4.9
0
2
3
3
6
Avg.
Run
Avg.
Pos.
Top
Top
Top
Top
Driver
#
Start
Pos.
Finish
Diff.
W
5
10
15
20
Austin Dillon
10
24.3
19.6
18.1
6.2
0
2
2
5
7
Ryan Newman
10
11.5
15.7
13.5
-2
0
1
5
6
8
David Ragan
10
26.5
24.9
21.9
4.6
0
1
2
2
3
Kyle Larson
9
9.4
15.7
21.2
-11.8
0
1
1
2
6
Daniel Suarez
5
14.8
19
16.8
-2
0
0
2
3
4
Ricky Stenhouse Jr
10
22.7
28.8
26.7
-4
0
0
2
3
4
Paul Menard
10
18
18.7
17.4
0.6
0
0
1
5
7
Aric Almirola
10
13.4
17.3
17.4
-4
0
0
1
5
8
Kurt Busch
10
15.8
12.8
20.7
-4.9
0
0
1
5
5
Alex Bowman
6
26.3
24.2
21
5.3
0
0
1
2
3
Laps
Laps Led
Fastest
Fast Laps
Top-15
Avg. Driver
Driver
#
Led
/Race
Laps
/Race
Rate
Rating
Kyle Busch
9
937
104.11
428
47.56
99%
122.1
Brad Keselowski
10
873
87.30
524
52.40
87%
113.3
Denny Hamlin
10
383
38.30
333
33.30
82%
102.1
Joey Logano
10
791
79.10
311
31.10
87%
107.3
Clint Bowyer
10
249
24.90
200
20.00
62%
86.6
Jimmie Johnson
10
116
11.60
124
12.40
62%
86.1
Martin Truex Jr
10
261
26.10
192
19.20
87%
96.3
Kevin Harvick
10
264
26.40
290
29.00
77%
96.3
Chase Elliott
8
192
24.00
214
26.75
64%
89.7
Ryan Blaney
7
145
20.71
80
11.43
63%
91
Laps
Laps Led
Fastest
Fast Laps
Top-15
Avg. Driver
Driver
#
Led
/Race
Laps
/Race
Rate
Rating
Austin Dillon
10
6
0.60
66
6.60
42%
72.7
Ryan Newman
10
2
0.20
46
4.60
51%
79.8
David Ragan
10
0
0.00
34
3.40
13%
56.4
Kyle Larson
9
29
3.22
44
4.89
59%
77.7
Daniel Suarez
5
0
0.00
22
4.40
37%
70.9
Ricky Stenhouse Jr
10
0
0.00
28
2.80
7%
49.3
Paul Menard
10
10
1.00
29
2.90
33%
69.7
Aric Almirola
10
0
0.00
75
7.50
42%
75.6
Kurt Busch
10
64
6.40
77
7.70
71%
83.3
Alex Bowman
6
0
0.00
30
5.00
24%
60.4
Team Averages at Martinsville (Since Feb. 2017)
Avg.
Top
Top
Driver
Finish
Races
Wins
5
10
Team Penske
7.85
13
3
8
10
Joe Gibbs Racing
12.05
20
1
7
12
Stewart-Haas Racing
12.25
20
1
4
11
Hendrick Motorsports
16
20
0
2
5
Wood Brothers Racing
16.6
5
0
0
1
Richard Childress Racing
17
12
0
1
3
JTG Daugherty Racing
17.3
10
0
0
2
Momentum
Drivers
Driver Momentum
Avg.
Run
Avg.
Pos.
Top
Top
Top
Top
Avg. Driver
Driver
#
Start
Pos.
Finish
Diff.
W
5
10
15
20
Rating
Martin Truex Jr
6
8.8
7
7.7
1.1
2
2
4
5
6
112.7
Denny Hamlin
6
11.7
8.3
3.5
8.2
1
6
6
6
6
106.3
Kyle Busch
6
11.8
7
4.3
7.5
1
4
6
6
6
116.2
Brad Keselowski
6
6.3
4.5
7.2
-0.9
1
3
5
5
6
117.5
Kevin Harvick
6
7
11.3
11.7
-4.7
1
2
4
5
5
99
Ryan Blaney
6
12.3
10
10.7
1.6
0
3
4
4
5
93.8
Joey Logano
6
9.7
11
10
-0.3
0
2
3
4
6
95.3
Chase Elliott
6
10.2
11.5
12.5
-2.3
0
2
2
5
5
93.9
Matt DiBenedetto
6
14.7
14.5
12.8
1.9
0
2
2
4
5
80.1
Clint Bowyer
6
12.2
9
8.7
3.5
0
1
5
5
6
97.3
Ryan Newman
6
19
14
10.7
8.3
0
1
4
5
5
81
Kurt Busch
6
10.7
10.5
11.7
-1
0
1
2
4
6
89.1
Avg.
Run
Avg.
Pos.
Top
Top
Top
Top
Avg. Driver
Driver
#
Start
Pos.
Finish
Diff.
W
5
10
15
20
Rating
Erik Jones
6
14.3
13.2
21.8
-7.5
0
1
1
2
2
84.7
Daniel Suarez
6
17.8
13.7
12
5.8
0
0
4
4
6
83.8
Paul Menard
6
16.3
17.7
15.7
0.6
0
0
2
4
4
70.4
Jimmie Johnson
6
17.5
17
17.5
0
0
0
2
3
4
73.6
Kyle Larson
6
10.3
16.5
19.8
-9.5
0
0
2
2
4
77
Austin Dillon
6
17.8
20.7
19.8
-2
0
0
1
3
3
68
Aric Almirola
6
10
18.5
20.8
-10.8
0
0
1
2
3
69.7
Alex Bowman
6
18.2
18
17.7
0.5
0
0
0
3
4
68.6
William Byron
6
19.5
18.5
18
1.5
0
0
0
2
3
65.5
Ty Dillon
6
23.5
20.7
18.5
5
0
0
0
2
4
61.1
Bubba Wallace
6
26.5
21.7
18.7
7.8
0
0
0
2
4
58.1
Chris Buescher
6
20.2
18.8
21.3
-1.1
0
0
0
1
2
63.2
Avg.
Run
Avg.
Pos.
Top
Top
Top
Top
Avg. Driver
Driver
#
Start
Pos.
Finish
Diff.
W
5
10
15
20
Rating
Daniel Hemric
6
21.5
25
25
-3.5
0
0
0
1
2
52
Ricky Stenhouse Jr
6
16.3
22.3
26.3
-10
0
0
0
1
2
58.4
Ryan Preece
6
22.2
24.2
21.7
0.5
0
0
0
0
3
53.5
Matt Tifft
6
29.8
27.8
26
3.8
0
0
0
0
1
41.7
David Ragan
6
20.8
23.7
27.3
-6.5
0
0
0
0
1
51.5
Andy Seuss
1
35
32
28
7
0
0
0
0
0
31
Landon Cassill
6
30
30
28
2
0
0
0
0
0
39.2
Corey LaJoie
6
28.2
27.5
28.2
0
0
0
0
0
0
43.3
Michael McDowell
6
20.3
26.7
28.3
-8
0
0
0
0
1
46.9
Ross Chastain
6
33
31.5
30
3
0
0
0
0
0
38.7
JJ Yeley
2
37
32.5
30.5
6.5
0
0
0
0
0
33.9
Kyle Weatherman
1
38
36
31
7
0
0
0
0
0
28.2
Avg.
Run
Avg.
Pos.
Top
Top
Top
Top
Avg. Driver
Driver
#
Start
Pos.
Finish
Diff.
W
5
10
15
20
Rating
Bayley Currey
2
30
32
31.5
-1.5
0
0
0
0
0
32.7
DJ Kennington
1
35
32
32
3
0
0
0
0
0
29.2
BJ McLeod
1
33
34
32
1
0
0
0
0
0
34.1
Quin Houff
5
33.6
34.4
32.4
1.2
0
0
0
0
0
28.3
Joey Gase
1
37
34
33
4
0
0
0
0
0
27.2
Jeb Burton
2
31.5
33.5
33
-1.5
0
0
0
0
0
28.9
Austin Theriault
2
34
33.5
33.5
0.5
0
0
0
0
0
30.1
Spencer Boyd
1
35
35
34
1
0
0
0
0
0
27.8
Reed Sorenon
3
34.3
34.3
34
0.3
0
0
0
0
0
29.8
Josh Bilicki
1
35
33
35
0
0
0
0
0
0
34.2
Timmy Hill
1
35
34
35
0
0
0
0
0
0
28.2
Cody Ware
1
33
36
36
-3
0
0
0
0
0
23.2
Gray Gaulding
1
33
34
36
-3
0
0
0
0
0
32.7
Team
Team Momentum
Avg.
Run
Avg.
Pos.
Top
Top
Top
Top
Team
#
Start
Pos.
Finish
Diff.
W
5
10
15
20
Chip Ganassi Racing
16
10.5
13.5
15.8
-5.3
0
1
4
6
10
Front Row Motorsports
24
23.6
26.1
27.2
-3.6
0
0
0
0
3
Hendrick Motorsports
32
16.4
16.3
16.4
-0.1
0
2
4
13
16
Joe Gibbs Racing
32
11.7
8.9
9.3
2.3
4
13
17
19
20
JTG Daugherty Racing
16
21.2
21.5
21.5
-0.3
0
0
0
1
5
Richard Childress Racing
16
19.7
22.9
22.4
-2.8
0
0
1
4
5
Roush Fenway Racing
16
17.7
18.2
18.5
-0.9
0
1
4
6
7
Stewart-Haas Racing
24
11.8
13.1
13.3
-1.6
1
3
14
16
20
Team Penske
24
9.4
8.5
9.3
0.1
1
8
12
13
17
Price Changes at Martinsville
DraftKings
DraftKings Price Changes
March
Oct.
Drivers
$
$
Difference
Kyle Busch
$13,000
$11,800
-$1,200
Martin Truex Jr
$11,900
$11,400
-$500
Denny Hamlin
$9,400
$11,000
$1,600
Kevin Harvick
$10,800
$10,500
-$300
Joey Logano
$11,300
$10,100
-$1,200
Chase Elliott
$8,200
$9,800
$1,600
Brad Keselowski
$12,400
$9,500
-$2,900
Ryan Blaney
$9,000
$9,300
$300
Kyle Larson
$9,700
$9,100
-$600
Clint Bowyer
$8,400
$8,900
$500
Erik Jones
$7,800
$8,700
$900
March
Oct.
Drivers
$
$
Difference
Kurt Busch
$10,200
$8,500
-$1,700
Alex Bowman
$7,400
$8,300
$900
Jimmie Johnson
$8,000
$8,100
$100
William Byron
$6,900
$8,000
$1,100
Matt DiBenedetto
$6,300
$7,800
$1,500
Aric Almirola
$8,700
$7,600
-$1,100
Ryan Newman
$6,800
$7,500
$700
Daniel Suarez
$7,600
$7,300
-$300
Paul Menard
$7,000
$7,100
$100
Ricky Stenhouse Jr
$7,200
$7,000
-$200
March
Oct.
Drivers
$
$
Difference
Chris Buescher
$6,500
$6,900
$400
Austin Dillon
$7,300
$6,700
-$600
Ryan Preece
$6,200
$6,600
$400
Daniel Hemric
$6,600
$6,400
-$200
Ty Dillon
$6,100
$6,200
$100
Bubba Wallace
$5,800
$6,100
$300
Michael McDowell
$5,900
$5,900
$0
David Ragan
$5,600
$5,800
$200
Corey LaJoie
$5,400
$5,600
$200
Ross Chastain
$5,500
$5,400
-$100
Matt Tifft
$5,300
$5,300
$0
Landon Cassill
$5,200
$5,200
$0
FanDuel
FanDuel Price Changes
March
Oct.
Drivers
$
$
Difference
Kyle Busch
$14,900
$15,000
$100
Denny Hamlin
$13,000
$14,500
$1,500
Martin Truex Jr
$13,500
$14,000
$500
Brad Keselowski
$13,700
$13,500
-$200
Chase Elliott
$11,900
$13,000
$1,100
Kevin Harvick
$12,500
$12,500
$0
Joey Logano
$14,000
$12,000
-$2,000
Ryan Blaney
$11,600
$11,500
-$100
Clint Bowyer
$11,700
$10,500
-$1,200
Kyle Larson
$9,700
$10,000
$300
Kurt Busch
$11,300
$9,600
-$1,700
March
Oct.
Drivers
$
$
Difference
Jimmie Johnson
$9,900
$9,200
-$700
Alex Bowman
$8,600
$9,000
$400
William Byron
$7,000
$8,500
$1,500
Erik Jones
$9,600
$8,000
-$1,600
Aric Almirola
$10,800
$7,700
-$3,100
Daniel Suarez
$8,300
$7,400
-$900
Matt DiBenedetto
$6,000
$7,000
$1,000
Ryan Newman
$8,900
$6,800
-$2,100
Paul Menard
$7,300
$6,500
-$800
Austin Dillon
$7,700
$6,300
-$1,400
March
Oct.
Drivers
$
$
Difference
Ricky Stenhouse Jr
$7,100
$6,000
-$1,100
Chris Buescher
$6,000
$5,500
-$500
Ryan Preece
$4,500
$5,500
$1,000
Ty Dillon
$5,500
$5,000
-$500
Bubba Wallace
$4,500
$4,500
$0
Michael McDowell
$4,500
$4,500
$0
Daniel Hemric
$6,500
$4,000
-$2,500
David Ragan
$5,000
$3,500
-$1,500
Corey LaJoie
$3,000
$3,000
$0
Landon Cassill
$4,000
$2,000
-$2,000
Matt Tifft
$3,500
$2,000
-$1,500
Ross Chastain
$3,500
$2,000
-$1,500
DraftKings Scoring Averages at Martinsville
Driver
2018
2017
2016
2015
2014
Last 2 Avg
Last 5 Avg
DK Seas. Avg.
Kyle Busch
86
137
59.25
43
33
111.50
71.65
61.14
Martin Truex Jr
104.5
56
86.25
43.75
-5.5
80.25
57.00
52.41
Denny Hamlin
88.75
43.75
79
55.75
66
66.25
66.65
48.51
Kevin Harvick
40.5
50
31
80.5
15
45.25
43.40
48.67
Joey Logano
157.75
41.75
41.25
48.75
64
99.75
70.70
45.42
Chase Elliott
49.5
57.25
28.5
53.38
45.08
40.52
Brad Keselowski
66.75
124.5
75
48.75
-8.5
95.63
61.30
43.21
Ryan Blaney
8
38.5
21
23.25
22.50
36.14
Kyle Larson
-20.5
-20.5
35
16.5
0.5
-20.50
2.20
39.28
Clint Bowyer
10.25
51.5
43
-23.5
53.75
30.88
27.00
28.81
Erik Jones
13.5
0
6.75
6.75
31.56
Kurt Busch
52.5
11.5
23.5
0
-9.75
32.00
15.55
36.38
Driver
2018
2017
2016
2015
2014
Last 2 Avg
Last 5 Avg
DK Seas. Avg.
Alex Bowman
30
41
18
30.00
29.67
34.83
Jimmie Johnson
57
53
81.5
48.5
2.5
55.00
48.50
27.21
William Byron
-22
-22.00
-22.00
31.02
Matt DiBenedetto
-0.5
-6
13.5
20
-3.25
6.75
31.93
Aric Almirola
30.5
18
30
22
33.5
24.25
26.80
30.07
Ryan Newman
53
35.5
27.5
39
48
44.25
40.60
34.51
Daniel Suarez
34
29.5
31.75
31.75
29.56
Paul Menard
35
23
12
40
31
29.00
28.20
29.08
Ricky Stenhouse Jr
26.5
46
3
-2.5
32
36.25
21.00
22.5
Chris Buescher
31.5
31
19
31.25
27.17
30.08
Austin Dillon
19
43.5
45.5
40.5
39
31.25
37.50
23.61
Ryan Preece
-3
-3.00
23.58
Driver
2018
2017
2016
2015
2014
Last 2 Avg
Last 5 Avg
DK Seas. Avg.
Daniel Hemric
16.85
Ty Dillon
40
10
25.00
25.00
28.74
Bubba Wallace
13
13.00
13.00
22.9
Michael McDowell
14
26
38
20.00
26.00
18.18
David Ragan
45.5
19
-11.5
26
53
32.25
26.40
15.04
Corey LaJoie
14
14.00
14.00
23.81
Ross Chastain
8
8.00
8.00
22.96
Matt Tifft
21.11
Landon Cassill
12
31
36.5
29.5
34
21.50
28.60
17.66
JJ Yeley
20
25
7.5
20.00
17.50
20.77
Reed Sorenson
12
2.5
5
12.00
6.50
15.57
Timmy Hill
9.5
14
1
9.50
8.17
13.42
FanDuel Scoring Averages at Martinsville
Driver
2018
2017
2016
2015
2014
Last 2 Avg
Last 5 Avg
FD Seas. Avg.
Kyle Busch
95.5
118.4
88.3
86.5
78.5
106.95
93.44
62.79
Martin Truex Jr
104.8
90.5
95.7
85.7
40.6
97.65
83.46
60.45
Denny Hamlin
93.6
84.7
95.3
91.8
88.3
89.15
90.74
60.68
Kevin Harvick
82
90.5
70.8
88.8
53.7
86.25
77.16
57.19
Joey Logano
128.4
61.8
80.6
52.5
90.5
95.10
82.76
58.83
Chase Elliott
90
64.7
75.4
77.35
76.70
53.51
Brad Keselowski
91.1
99.8
98.5
61.8
44.7
95.45
79.18
55.48
Ryan Blaney
63
81.5
69.8
72.25
71.43
52.38
Kyle Larson
29.3
20
76
67
52.7
24.65
49.00
51.57
Clint Bowyer
60.5
89.5
62.5
6.5
89.8
75.00
61.76
49.25
Erik Jones
61.9
56.4
59.15
59.15
49.02
Kurt Busch
85
64
69.2
48.3
37.9
74.50
60.88
54.44
Driver
2018
2017
2016
2015
2014
Last 2 Avg
Last 5 Avg
FD Seas. Avg.
Alex Bowman
72.5
78.4
62.5
72.50
71.13
52.81
Jimmie Johnson
90
87.9
103.2
83.5
42.4
88.95
81.40
49.11
William Byron
24.4
24.40
24.40
51.45
Matt DiBenedetto
45.1
15.2
55.4
63.2
30.15
44.73
50.32
Aric Almirola
77
69.5
76.4
71
73
73.25
73.38
50.10
Ryan Newman
87
79.5
73.4
84
91
83.25
82.98
53.83
Daniel Suarez
81.5
76.5
79.00
79.00
49.85
Paul Menard
75.4
71
62.1
81.5
77
73.20
73.40
50.59
Ricky Stenhouse Jr
71.5
87.5
2.6
39.3
77.5
79.50
55.68
44.92
Chris Buescher
78
74.5
64.5
76.25
72.33
50.33
Austin Dillon
57.6
84.5
81.4
79.6
82.5
71.05
77.12
45.10
Ryan Preece
35
35.00
44.99
Driver
2018
2017
2016
2015
2014
Last 2 Avg
Last 5 Avg
FD Seas. Avg.
Daniel Hemric
40.23
Ty Dillon
80
59.1
69.55
69.55
49.25
Bubba Wallace
57.3
57.30
57.30
43.70
Michael McDowell
63.2
73
78.8
68.10
71.67
39.83
David Ragan
82
64.8
33.9
67.3
90.5
73.40
67.70
38.87
Corey LaJoie
59.5
59.50
59.50
43.51
Ross Chastain
57.7
57.70
57.70
40.66
Matt Tifft
41.97
Landon Cassill
58
73.5
63.4
73
76.5
65.75
68.88
37.26
JJ Yeley
62.6
66.2
46.1
62.60
58.30
38.95
Reed Sorenson
59
41.7
48.2
59.00
49.63
32.93
Timmy Hill
40.8
53.9
3.5
40.80
32.73
24.67
Weekly Ranks (1=Best, 40=Worst)
Race History, Momentum, and Martinsville History columns are ranked on the average finish in those spans from best to worst. Scoring averages are ranked from highest scoring to lowest scoring over those spans.