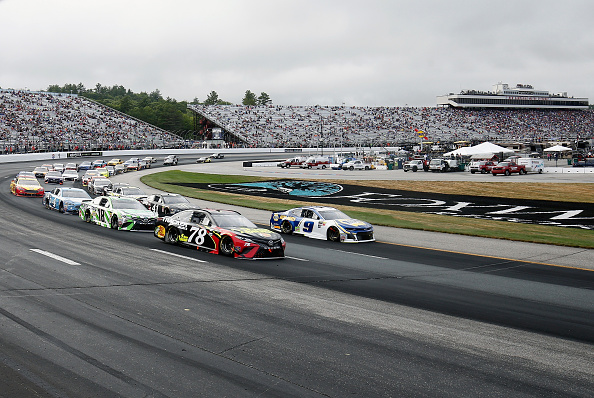
The northeast beckons this week as the NASCAR Cup Series heads north to the hamlet of Loudon, New Hampshire for the Foxwoods Resort 301 at New Hampshire Motor Speedway. This is a gem of a track and the only trip to the northeast the Cup series will make this year, as the track lost its second date starting last year. It is a 1-mile track but different than the others, in that it is nearly entirely flat. Seriously. The straightaways are banked at one degree and the turns have progressive banking that goes from two to seven degrees the further out you get. That’s half as much as Phoenix or Richmond or even Martinsville has. If you think it’s a follow the leader type track though, you’d be mistaken. Just check out the starting positions table below.
Starting Positions for Winners
| Starting Pos. | Races Won | Starting Pos. | Races Won |
| 1 | 6 | 14 | 2 |
| 2 | 3 | 15 | 1 |
| 3 | 1 | 18 | 1 |
| 4 | 2 | 19 | 1 |
| 5 | 1 | 20 | 1 |
| 6 | 3 | 21 | 1 |
| 7 | 3 | 24 | 1 |
| 8 | 2 | 26 | 1 |
| 9 | 3 | 31 | 2 |
| 10 | 1 | 32 | 2 |
| 11 | 2 | 33 | 1 |
| 13 | 5 | 38 | 1 |
There have been 47 races at NHMS since the Cup series first came to the track in July of 1993 and only six times has the pole-sitter finish in Victory Lane. The last time was Kyle Busch in 2017 but prior to that, it was 2011 and Ryan Newman pulling off that feat. There have also been 24 different positions to see a winner with P13 seeing nearly as many as the pole.
Sunday’s race will have 301 scheduled laps so there’s a nice number of fastest laps and laps led points to be had. Four of the last five races here have seen at least one if not two drivers lead 100 laps. Four of the last five races have also seen at least six drivers post double-digit positive position differentials so despite being a flat, shorter, track you can in fact have movement here. The new tires they are using at the track should increase the grip, which is necessary here with the flatness of the banking, and make for good driving conditions according to Goodyear.
Drivers To Watch This Week:
There is normally a video here, but this week, for technical reasons, this section will be written. I hope you don’t mind.
Kyle Busch - $11,900 on DK and $14,500 on FD
Another week with Busch atop the salary charts and atop the drivers to watch section. It’s just too hard not to play him. He’s posted a win, three top-fives, four top-10s, the best average finish at 5.0 in the last five July races, and the most laps led and fastest laps in that span. Over the last 10 races overall here, there’s two wins, six top-fives, and eight top-10s to bolster his record. Busch has also been great at the comparable tracks to New Hampshire in the last few years and this season as well. He’s pricey but based on history, there’s really no reason not to look at him.
Kevin Harvick - $11,100 on DK and $12,500 on FD
Harvick has a very similar history at New Hampshire to Kyle Busch. He’s notched a win, four top-fives, four top-10s, and an average finish of 8.6 in the last five July races. In addition, he has two wins, six top-fives, six top-10s and an average finish of 12.4 in the last 10 races here. We all know how good Harvick has been at Phoenix, well that’s a comparable track as is Richmond and Martinsville. He’s been finding that speed again of late and this is a track that he’s had success at before which makes for a good combination to put in a lineup for DFS.
Denny Hamlin - $9,700 on DK and $11,500 on FD
Hamlin hasn’t been quite as solid as his colleagues above him but he does have a win and three top-10s in the last five July races and an average finish of 12.3 in the last 10 races overall. The other joy of putting him in this section is so you can google him running away from the Lobster they award the winner. He is scared of lobsters. In the three comparable tracks they’ve run this year already (Richmond, Martinsville, Phoenix), Hamlin has three top-fives and an average position differential of 7.7 in those races. The price is still relatively inexpensive for a two-time winner this year and a guy that’s solid at these types of tracks.
Ryan Newman - $7,600 on DK and $8,000 on FD
Newman has a top-five and three top-10s in the last five July races here with the best position differential mark in the field at 12.2. In the last 10, his average finish of 13.3 is good enough to rank ninth in the field. Don’t leave out the fact that his DK and FD scoring averages over the last five races rank fifth and fourth respectively in the field. Newman is the type of guy that knows how to hustle a car around a track, and that’s exactly what’s needed here.
Kyle Larson - $9,400 on DK and $10,400 on FD – Contrarian
Larson is the contrarian play this week as his driving style on the outset doesn’t seem to fit the style of track they are racing at this weekend. However, that couldn’t be further from the truth based on his results. In the last five July races, he has two top-fives and two top-10s and a PD mark of 8.2. In the nine Cup races that he’s run here, there are four top-fives, five top-10s, and a 10.7 average finish. For a guy that seems to like the outside lane and does better at the bigger tracks, he also has a dirt track background which means he knows how to fight for spots in tight spaces, which all you get at New Hampshire. The scoring is there too as he’s ranked top-six in the last five races on DraftKings and FanDuel.
Erik Jones - $9,000 on DK and $9,000 on FD – Fade
Jones has started the last two July races here P7 and P6 respectively and in one he finished P16 and the other, dead last. He did land a top-10 in the Fall race that ran here, but the track is different in the Fall. At these types of tracks in his career, he’s not been great. He’s been okay but not great. At this distance and track-type this year he’s not done well either and in his career, Jones has a 49-percent top-15 rate despite an average start of 12.3. At Jones’ price point there are better options that have shown better both here and at similar tracks this season.
Last Five Foxwoods Resort 301s
| | | Avg. | Run | Avg. | Pos. | | Top | Top | Top | Top |
| Driver | # | Start | Pos. | Finish | Diff. | W | 5 | 10 | 15 | 20 |
| Kevin Harvick | 5 | 11.6 | 6.4 | 8.6 | 3 | 1 | 4 | 4 | 4 | 4 |
| Kyle Busch | 5 | 3.4 | 3.8 | 5 | -1.6 | 1 | 3 | 4 | 5 | 5 |
| Brad Keselowski | 5 | 8.4 | 7.8 | 11.8 | -3.4 | 1 | 2 | 3 | 4 | 4 |
| Denny Hamlin | 5 | 5 | 8.8 | 9 | -4 | 1 | 1 | 3 | 5 | 5 |
| Joey Logano | 5 | 9.2 | 13.4 | 18.6 | -9.4 | 0 | 2 | 3 | 3 | 3 |
| Martin Truex Jr | 5 | 6 | 8 | 9.4 | -3.4 | 0 | 2 | 2 | 4 | 5 |
| Kyle Larson | 5 | 21.2 | 16.2 | 13 | 8.2 | 0 | 2 | 2 | 3 | 4 |
| Ryan Newman | 5 | 23.4 | 17.6 | 11.2 | 12.2 | 0 | 1 | 3 | 4 | 4 |
| Chase Elliott | 3 | 9.3 | 8.7 | 16.7 | -7.4 | 0 | 1 | 1 | 2 | 2 |
| Aric Almirola | 5 | 21.6 | 18 | 16.8 | 4.8 | 0 | 1 | 1 | 2 | 3 |
| Kurt Busch | 5 | 7.6 | 9.2 | 13 | -5.4 | 0 | 0 | 3 | 3 | 4 |
| Ricky Stenhouse Jr | 5 | 23.2 | 18.6 | 16 | 7.2 | 0 | 0 | 2 | 3 | 4 |
| | | Avg. | Run | Avg. | Pos. | | Top | Top | Top | Top |
| Driver | # | Start | Pos. | Finish | Diff. | W | 5 | 10 | 15 | 20 |
| Jimmie Johnson | 5 | 6.6 | 18.4 | 19.2 | -12.6 | 0 | 0 | 2 | 3 | 3 |
| Clint Bowyer | 5 | 18.4 | 17.2 | 21.2 | -2.8 | 0 | 0 | 2 | 2 | 2 |
| Austin Dillon | 5 | 21 | 19 | 14.2 | 6.8 | 0 | 0 | 1 | 4 | 4 |
| Ryan Blaney | 4 | 12.5 | 14.8 | 15 | -2.5 | 0 | 0 | 1 | 2 | 3 |
| Daniel Suarez | 2 | 11.5 | 17.5 | 14 | -2.5 | 0 | 0 | 1 | 1 | 1 |
| William Byron | 1 | 11 | 16 | 14 | -3 | 0 | 0 | 0 | 1 | 1 |
| Alex Bowman | 4 | 26 | 27 | 27.5 | -1.5 | 0 | 0 | 0 | 1 | 1 |
| Ty Dillon | 2 | 25 | 23 | 19.5 | 5.5 | 0 | 0 | 0 | 0 | 1 |
| Paul Menard | 5 | 21.8 | 19.8 | 20.2 | 1.6 | 0 | 0 | 0 | 0 | 3 |
| Bubba Wallace | 1 | 27 | 26 | 24 | 3 | 0 | 0 | 0 | 0 | 0 |
| Chris Buescher | 3 | 27 | 26 | 24.7 | 2.3 | 0 | 0 | 0 | 0 | 1 |
| Ross Chastain | 1 | 32 | 28 | 25 | 7 | 0 | 0 | 0 | 0 | 0 |
| | | Avg. | Run | Avg. | Pos. | | Top | Top | Top | Top |
| Driver | # | Start | Pos. | Finish | Diff. | W | 5 | 10 | 15 | 20 |
| David Ragan | 5 | 22.8 | 25.8 | 26.2 | -3.4 | 0 | 0 | 0 | 0 | 1 |
| Erik Jones | 2 | 6.5 | 25 | 27.5 | -21 | 0 | 0 | 0 | 0 | 1 |
| Corey LaJoie | 2 | 32 | 30 | 29 | 3 | 0 | 0 | 0 | 0 | 0 |
| Michael McDowell | 3 | 25.3 | 30.3 | 30.3 | -5 | 0 | 0 | 0 | 0 | 0 |
| Landon Cassill | 5 | 27.8 | 30 | 30.4 | -2.6 | 0 | 0 | 0 | 0 | 0 |
| Matt DiBenedetto | 4 | 23.8 | 30.5 | 31 | -7.2 | 0 | 0 | 0 | 0 | 0 |
| Reed Sorenson | 3 | 36 | 33.3 | 34 | 2 | 0 | 0 | 0 | 0 | 0 |
| Daniel Hemric | 0 | 0 | 0 | 0 | 0 | 0 | 0 | 0 | 0 | 0 |
| Matt Tifft | 0 | 0 | 0 | 0 | 0 | 0 | 0 | 0 | 0 | 0 |
| Andy Seuss | 0 | 0 | 0 | 0 | 0 | 0 | 0 | 0 | 0 | 0 |
| Austin Theriault | 0 | 0 | 0 | 0 | 0 | 0 | 0 | 0 | 0 | 0 |
| Quin Houff | 0 | 0 | 0 | 0 | 0 | 0 | 0 | 0 | 0 | 0 |
| Ryan Preece | 0 | 0 | 0 | 0 | 0 | 0 | 0 | 0 | 0 | 0 |
| | | Laps | Laps Led | Fastest | Fast Laps | Top-15 | Avg. Driver | Laps |
| Driver | # | Led | /Race | Laps | /Race | Rate | Rating | Comp, |
| Kevin Harvick | 5 | 71 | 14.2 | 150 | 30.0 | 97% | 110.4 | 1508 |
| Kyle Busch | 5 | 422 | 84.4 | 187 | 37.4 | 97% | 125.4 | 1509 |
| Brad Keselowski | 5 | 239 | 47.8 | 183 | 36.6 | 89% | 108 | 1501 |
| Denny Hamlin | 5 | 79 | 15.8 | 77 | 15.4 | 83% | 104 | 1509 |
| Joey Logano | 5 | 15 | 3.0 | 12 | 2.4 | 73% | 89.9 | 1383 |
| Martin Truex Jr | 5 | 343 | 68.6 | 159 | 31.8 | 86% | 111.7 | 1509 |
| Kyle Larson | 5 | 15 | 0 | 53 | 0 | 51% | 85.2 | 1507 |
| Ryan Newman | 5 | 0 | 0.0 | 13 | 2.6 | 40% | 79.1 | 1508 |
| Chase Elliott | 3 | 23 | 7.7 | 26 | 8.7 | 92% | 95.9 | 896 |
| Aric Almirola | 5 | 42 | 8.4 | 44 | 8.8 | 29% | 75.6 | 1509 |
| Kurt Busch | 5 | 95 | 19.0 | 76 | 15.2 | 79% | 98.7 | 1509 |
| Ricky Stenhouse Jr | 5 | 11 | 2.2 | 6 | 1.2 | 35% | 73 | 1203 |
| | | Laps | Laps Led | Fastest | Fast Laps | Top-15 | Avg. Driver | Laps |
| Driver | # | Led | /Race | Laps | /Race | Rate | Rating | Comp, |
| Jimmie Johnson | 5 | 1 | 0.2 | 11 | 2.2 | 55% | 78.8 | 1214 |
| Clint Bowyer | 5 | 36 | 7.2 | 17 | 3.4 | 52% | 76.9 | 1459 |
| Austin Dillon | 5 | 0 | 0.0 | 12 | 2.4 | 28% | 73.2 | 1508 |
| Ryan Blaney | 4 | 0 | 0.0 | 26 | 6.5 | 64% | 84.5 | 1203 |
| Daniel Suarez | 2 | 0 | 0.0 | 5 | 2.5 | 30% | 72.9 | 601 |
| William Byron | 1 | 0 | 0.0 | 0 | 0.0 | 62% | 76.3 | 301 |
| Alex Bowman | 4 | 0 | 0.0 | 9 | 2.3 | 21% | 53.7 | 1135 |
| Ty Dillon | 2 | 0 | 0.0 | 0 | 0.0 | 5% | 61.6 | 601 |
| Paul Menard | 5 | 0 | 0.0 | 2 | 0.4 | 31% | 65.3 | 1508 |
| Bubba Wallace | 1 | 0 | 0.0 | 0 | 0.0 | 0% | 49.2 | 299 |
| Chris Buescher | 3 | 0 | 0.0 | 2 | 0.7 | 1% | 48.1 | 899 |
| Ross Chastain | 1 | 0 | 0.0 | 0 | 0.0 | 1% | 41.2 | 298 |
| | | Laps | Laps Led | Fastest | Fast Laps | Top-15 | Avg. Driver | Laps |
| Driver | # | Led | /Race | Laps | /Race | Rate | Rating | Comp, |
| David Ragan | 5 | 0 | 0.0 | 8 | 1.6 | 9% | 52.3 | 1503 |
| Erik Jones | 2 | 0 | 0.0 | 2 | 1.0 | 16% | 55.4 | 341 |
| Corey LaJoie | 2 | 0 | 0.0 | 0 | 0.0 | 0% | 39.1 | 596 |
| Michael McDowell | 3 | 0 | 0.0 | 2 | 0.7 | 0% | 40.8 | 789 |
| Landon Cassill | 5 | 0 | 0.0 | 0 | 0.0 | 5% | 42.8 | 1213 |
| Matt DiBenedetto | 4 | 0 | 0.0 | 1 | 0.3 | 0% | 42.1 | 1192 |
| Reed Sorenson | 3 | 0 | 0.0 | 2 | 0.7 | 0% | 36.1 | 1193 |
| Daniel Hemric | 0 | 0 | 0 | 0 | 0 | 0 | 0 | 0 |
| Matt Tifft | 0 | 0 | 0 | 0 | 0 | 0 | 0 | 0 |
| Andy Seuss | 0 | 0 | 0 | 0 | 0 | 0 | 0 | 0 |
| Austin Theriault | 0 | 0 | 0 | 0 | 0 | 0 | 0 | 0 |
| Quin Houff | 0 | 0 | 0 | 0 | 0 | 0 | 0 | 0 |
| Ryan Preece | 0 | 0 | 0 | 0 | 0 | 0 | 0 | 0 |
Top-20 Driver Over Last 10 Races at New Hampshire Motor Speedway
| | | Avg. | Run | Avg. | Pos. | | Top | Top | Top | Top |
| Driver | # | Start | Pos. | Finish | Diff. | W | 5 | 10 | 15 | 20 |
| Kyle Busch | 10 | 6.4 | 6.8 | 7.6 | -1.2 | 2 | 6 | 8 | 9 | 9 |
| Kevin Harvick | 10 | 9.6 | 8.1 | 12.4 | -2.8 | 2 | 6 | 6 | 6 | 7 |
| Brad Keselowski | 10 | 9.1 | 8 | 9.7 | -0.6 | 1 | 4 | 6 | 9 | 9 |
| Joey Logano | 10 | 12.1 | 12.2 | 13.2 | -1.1 | 1 | 4 | 6 | 8 | 8 |
| Denny Hamlin | 10 | 5.8 | 11.2 | 12.3 | -6.5 | 1 | 2 | 4 | 9 | 9 |
| Kyle Larson | 9 | 14.4 | 13.4 | 10.7 | 3.7 | 0 | 4 | 5 | 6 | 8 |
| Martin Truex Jr | 10 | 9.5 | 9 | 8.9 | 0.6 | 0 | 3 | 6 | 9 | 10 |
| Jimmie Johnson | 10 | 7.1 | 12.9 | 13.3 | -6.2 | 0 | 2 | 6 | 8 | 8 |
| Ryan Newman | 10 | 15.7 | 15.4 | 13.3 | 2.4 | 0 | 1 | 4 | 6 | 9 |
| Kurt Busch | 10 | 8 | 12.5 | 17.5 | -9.5 | 0 | 1 | 4 | 5 | 7 |
| | | Avg. | Run | Avg. | Pos. | | Top | Top | Top | Top |
| Driver | # | Start | Pos. | Finish | Diff. | W | 5 | 10 | 15 | 20 |
| Aric Almirola | 10 | 21.2 | 21.2 | 19.7 | 1.5 | 0 | 1 | 2 | 3 | 5 |
| Chase Elliott | 5 | 10.4 | 8.8 | 14.8 | -4.4 | 0 | 1 | 1 | 4 | 4 |
| Clint Bowyer | 10 | 20.1 | 18.1 | 19.2 | 0.9 | 0 | 0 | 3 | 4 | 5 |
| Ricky Stenhouse Jr | 10 | 22.5 | 19.7 | 19.5 | 3 | 0 | 0 | 2 | 5 | 6 |
| Ryan Blaney | 6 | 11.7 | 14.2 | 13.5 | -1.8 | 0 | 0 | 2 | 4 | 5 |
| Daniel Suarez | 3 | 16 | 16.7 | 12 | 4 | 0 | 0 | 2 | 2 | 2 |
| Austin Dillon | 9 | 21 | 19.6 | 15.4 | 5.6 | 0 | 0 | 1 | 5 | 7 |
| Erik Jones | 3 | 7 | 18.3 | 20.3 | -13.3 | 0 | 0 | 1 | 1 | 2 |
| Paul Menard | 10 | 19.2 | 19.6 | 19.8 | -0.6 | 0 | 0 | 0 | 2 | 6 |
| Alex Bowman | 7 | 27.6 | 27 | 27.7 | -0.1 | 0 | 0 | 0 | 2 | 2 |
| | | Laps | Laps Led | Fastest | Fast Laps | Top-15 | Avg. Driver |
| Driver | # | Led | /Race | Laps | /Race | Rate | Rating |
| Kyle Busch | 10 | 612 | 61.2 | 325 | 32.5 | 90% | 117.6 |
| Kevin Harvick | 10 | 399 | 39.9 | 313 | 31.3 | 88% | 106.4 |
| Brad Keselowski | 10 | 325 | 32.5 | 293 | 29.3 | 89% | 106.2 |
| Joey Logano | 10 | 89 | 8.9 | 82 | 8.2 | 73% | 93.8 |
| Denny Hamlin | 10 | 132 | 13.2 | 147 | 14.7 | 79% | 101.7 |
| Kyle Larson | 9 | 16 | 1.78 | 94 | 10.44 | 63% | 91.1 |
| Martin Truex Jr | 10 | 694 | 69.4 | 267 | 26.7 | 81% | 108.9 |
| Jimmie Johnson | 10 | 2 | 0.2 | 51 | 5.1 | 76% | 91.8 |
| Ryan Newman | 10 | 2 | 0.2 | 19 | 1.9 | 57% | 80.5 |
| Kurt Busch | 10 | 95 | 9.5 | 78 | 7.8 | 71% | 88.1 |
| | | Laps | Laps Led | Fastest | Fast Laps | Top-15 | Avg. Driver |
| Driver | # | Led | /Race | Laps | /Race | Rate | Rating |
| Aric Almirola | 10 | 42 | 4.2 | 55 | 5.5 | 23% | 69 |
| Chase Elliott | 5 | 24 | 4.8 | 45 | 9 | 91% | 95.6 |
| Clint Bowyer | 10 | 41 | 4.1 | 22 | 2.2 | 42% | 74.4 |
| Ricky Stenhouse Jr | 10 | 11 | 1.1 | 8 | 0.8 | 26% | 69.7 |
| Ryan Blaney | 6 | 0 | 0 | 26 | 4.33 | 61% | 85.4 |
| Daniel Suarez | 3 | 0 | 0 | 5 | 1.67 | 43% | 76.2 |
| Austin Dillon | 9 | 0 | 0 | 12 | 1.33 | 20% | 70.3 |
| Erik Jones | 3 | 0 | 0 | 35 | 11.67 | 44% | 74 |
| Paul Menard | 10 | 0 | 0 | 2 | 0.2 | 25% | 66.9 |
| Alex Bowman | 7 | 0 | 0 | 10 | 1.43 | 25% | 54.3 |
Top-20 Drivers at Similar Races (Phoenix, Martinsville, Richmond, New Hampshire)
| | | Avg. | Run | Avg. | Pos. | | Top | Top | Top | Top |
| Driver | # | Start | Pos. | Finish | Diff. | W | 5 | 10 | 15 | 20 |
| Kyle Busch | 20 | 8 | 4.7 | 4.4 | 3.6 | 6 | 14 | 18 | 19 | 20 |
| Kevin Harvick | 20 | 8.9 | 8.2 | 7.5 | 1.4 | 3 | 13 | 17 | 18 | 19 |
| Brad Keselowski | 20 | 10.6 | 8.1 | 9 | 1.6 | 2 | 9 | 14 | 17 | 19 |
| Joey Logano | 20 | 9.2 | 11.4 | 12.8 | -3.6 | 2 | 7 | 11 | 14 | 16 |
| Martin Truex Jr | 20 | 6.1 | 6 | 7.6 | -1.5 | 1 | 11 | 14 | 17 | 20 |
| Denny Hamlin | 20 | 7.6 | 9.3 | 10.3 | -2.7 | 1 | 9 | 12 | 17 | 18 |
| Kyle Larson | 20 | 10.5 | 13.1 | 15.2 | -4.7 | 1 | 5 | 9 | 11 | 16 |
| Clint Bowyer | 20 | 16.1 | 12.7 | 13.7 | 2.4 | 1 | 3 | 10 | 14 | 14 |
| Ryan Newman | 20 | 17.7 | 14.6 | 13.6 | 4.1 | 1 | 2 | 8 | 14 | 17 |
| Chase Elliott | 20 | 9.9 | 8.7 | 11.6 | -1.7 | 0 | 7 | 10 | 16 | 16 |
| | | Avg. | Run | Avg. | Pos. | | Top | Top | Top | Top |
| Driver | # | Start | Pos. | Finish | Diff. | W | 5 | 10 | 15 | 20 |
| Aric Almirola | 20 | 18.7 | 15.4 | 13.6 | 5.1 | 0 | 4 | 8 | 10 | 17 |
| Ryan Blaney | 20 | 8.3 | 12.4 | 16.6 | -8.3 | 0 | 3 | 6 | 8 | 14 |
| Kurt Busch | 20 | 10 | 12.5 | 15.8 | -5.8 | 0 | 2 | 8 | 12 | 13 |
| Ricky Stenhouse Jr | 20 | 18.1 | 20 | 17.5 | 0.6 | 0 | 2 | 6 | 10 | 13 |
| Erik Jones | 18 | 12.3 | 17.4 | 17.8 | -5.5 | 0 | 1 | 5 | 9 | 12 |
| Austin Dillon | 20 | 21.2 | 17 | 16 | 5.2 | 0 | 1 | 4 | 10 | 15 |
| Jimmie Johnson | 20 | 16.6 | 13 | 13.1 | 3.5 | 0 | 0 | 8 | 18 | 18 |
| Daniel Suarez | 18 | 19.6 | 19.1 | 15.3 | 4.3 | 0 | 0 | 8 | 10 | 14 |
| Alex Bowman | 12 | 11.9 | 16 | 17.8 | -5.9 | 0 | 0 | 1 | 6 | 9 |
| William Byron | 10 | 15.4 | 17.4 | 18.5 | -3.1 | 0 | 0 | 1 | 5 | 7 |
| | | Laps | Laps Led | Fastest | Fast Laps | Top-15 | Avg. Driver |
| Driver | # | Led | /Race | Laps | /Race | Rate | Rating |
| Kyle Busch | 20 | 1836 | 91.8 | 950 | 47.5 | 97% | 122.3 |
| Kevin Harvick | 20 | 220 | 11.0 | 439 | 22.0 | 90% | 104.8 |
| Brad Keselowski | 20 | 976 | 48.8 | 670 | 33.5 | 86% | 104.9 |
| Joey Logano | 20 | 625 | 31.3 | 284 | 14.2 | 75% | 94.3 |
| Martin Truex Jr | 20 | 1339 | 67.0 | 645 | 32.3 | 95% | 113.3 |
| Denny Hamlin | 20 | 530 | 26.5 | 405 | 20.3 | 84% | 100.4 |
| Kyle Larson | 20 | 152 | 7.6 | 222 | 11.1 | 69% | 89 |
| Clint Bowyer | 20 | 261 | 13.1 | 261 | 13.1 | 70% | 89 |
| Ryan Newman | 20 | 58 | 2.9 | 109 | 5.5 | 61% | 79.6 |
| Chase Elliott | 20 | 406 | 20.3 | 418 | 20.9 | 85% | 98.7 |
| | | Laps | Laps Led | Fastest | Fast Laps | Top-15 | Avg. Driver |
| Driver | # | Led | /Race | Laps | /Race | Rate | Rating |
| Aric Almirola | 20 | 69 | 3.5 | 166 | 8.3 | 48% | 80.2 |
| Ryan Blaney | 20 | 253 | 12.7 | 145 | 7.3 | 64% | 86.2 |
| Kurt Busch | 20 | 251 | 12.6 | 234 | 11.7 | 74% | 88.3 |
| Ricky Stenhouse Jr | 20 | 13 | 0.7 | 98 | 4.9 | 27% | 67.7 |
| Erik Jones | 18 | 11 | 0.6 | 106 | 5.9 | 49% | 74.4 |
| Austin Dillon | 20 | 0 | 0.0 | 84 | 4.2 | 44% | 74 |
| Jimmie Johnson | 20 | 29 | 1.5 | 104 | 5.2 | 71% | 85.5 |
| Daniel Suarez | 18 | 0 | 0.0 | 79 | 4.4 | 36% | 70.7 |
| Alex Bowman | 12 | 1 | 0.1 | 45 | 3.8 | 54% | 74.8 |
| William Byron | 10 | 15 | 1.5 | 34 | 3.4 | 43% | 71.6 |
Team Averages at New Hampshire
| | Avg. | | | Top | Top |
| Driver | Finish | Races | Wins | 5 | 10 |
| Joe Gibbs Racing | 8.33 | 12 | 2 | 5 | 7 |
| Chip Ganassi Racing | 11.17 | 6 | 0 | 2 | 2 |
| Furniture Row Racing | 11.4 | 5 | 0 | 3 | 4 |
| Stewart-Haas Racing | 14.83 | 12 | 1 | 3 | 7 |
| Wood Brothers Racing | 15 | 3 | 0 | 0 | 1 |
| Team Penske | 15.43 | 7 | 0 | 1 | 5 |
| Hendrick Motorsports | 16.75 | 12 | 0 | 1 | 3 |
| Richard Childress Racing | 17.88 | 8 | 0 | 0 | 1 |
Momentum
This section will show how drivers have on this type of track this season
Drivers
| Driver Momentum |
| | | Avg. | Run | Avg. | Pos. | | Top | Top | Top | Top | Laps | Fast | Laps | Avg. Driver |
| Driver | # | Start | Pos. | Finish | Diff. | W | 5 | 10 | 15 | 20 | Led | Laps | Comp. | Rating |
| Martin Truex Jr | 3 | 7.3 | 5.3 | 3.7 | 3.6 | 1 | 2 | 3 | 3 | 3 | 186 | 79 | 1212 | 118.7 |
| Kyle Busch | 3 | 7 | 5.3 | 4 | 3 | 1 | 2 | 3 | 3 | 3 | 278 | 182 | 1212 | 122.6 |
| Brad Keselowski | 3 | 5.3 | 9.7 | 9 | -3.7 | 1 | 1 | 2 | 2 | 3 | 477 | 103 | 1211 | 107.9 |
| Denny Hamlin | 3 | 12.7 | 9.3 | 5 | 7.7 | 0 | 3 | 3 | 3 | 3 | 7 | 40 | 1212 | 100.3 |
| Ryan Blaney | 3 | 13.3 | 11 | 10.7 | 2.6 | 0 | 2 | 2 | 2 | 2 | 94 | 62 | 1210 | 97.3 |
| Kevin Harvick | 3 | 4.3 | 6.3 | 6.3 | -2 | 0 | 1 | 3 | 3 | 3 | 30 | 88 | 1212 | 108.7 |
| Clint Bowyer | 3 | 16.7 | 7.7 | 7 | 9.7 | 0 | 1 | 2 | 3 | 3 | 0 | 65 | 1212 | 101.3 |
| Joey Logano | 3 | 5.3 | 7.7 | 10.3 | -5 | 0 | 1 | 2 | 2 | 3 | 57 | 48 | 1212 | 100.5 |
| Aric Almirola | 3 | 15.7 | 11.3 | 12 | 3.7 | 0 | 1 | 2 | 2 | 2 | 26 | 36 | 1210 | 89.3 |
| Chase Elliott | 3 | 13.7 | 12.3 | 10.3 | 3.4 | 0 | 1 | 1 | 3 | 3 | 49 | 96 | 1212 | 89.3 |
| | | Avg. | Run | Avg. | Pos. | | Top | Top | Top | Top | Laps | Fast | Laps | Avg. Driver |
| Driver | # | Start | Pos. | Finish | Diff. | W | 5 | 10 | 15 | 20 | Led | Laps | Comp. | Rating |
| Kurt Busch | 3 | 12.3 | 11 | 10 | 2.3 | 0 | 0 | 1 | 3 | 3 | 0 | 8 | 1212 | 88.7 |
| Austin Dillon | 3 | 16 | 11 | 12.7 | 3.3 | 0 | 0 | 1 | 2 | 2 | 0 | 36 | 1211 | 84.9 |
| Paul Menard | 3 | 13.3 | 13.7 | 14 | -0.7 | 0 | 0 | 1 | 2 | 3 | 0 | 1 | 1211 | 77 |
| Ryan Newman | 3 | 20.7 | 16.7 | 14.7 | 6 | 0 | 0 | 1 | 2 | 2 | 0 | 6 | 1211 | 71.1 |
| Jimmie Johnson | 3 | 20 | 14.3 | 14.7 | 5.3 | 0 | 0 | 1 | 2 | 2 | 4 | 4 | 1210 | 77.8 |
| Daniel Suarez | 3 | 23.3 | 17.3 | 17 | 6.3 | 0 | 0 | 1 | 1 | 2 | 0 | 33 | 1210 | 75 |
| Kyle Larson | 3 | 15.7 | 18.7 | 20.3 | -4.6 | 0 | 0 | 1 | 1 | 2 | 0 | 4 | 937 | 70.6 |
| Ty Dillon | 3 | 21.7 | 19.3 | 16.3 | 5.4 | 0 | 0 | 0 | 2 | 2 | 0 | 11 | 1210 | 64.5 |
| Ricky Stenhouse Jr | 3 | 18 | 18.7 | 18 | 0 | 0 | 0 | 0 | 1 | 2 | 0 | 2 | 1210 | 64.1 |
| William Byron | 3 | 18 | 17.7 | 19.7 | -1.7 | 0 | 0 | 0 | 1 | 1 | 0 | 11 | 1209 | 68.1 |
| | | Avg. | Run | Avg. | Pos. | | Top | Top | Top | Top | Laps | Fast | Laps | Avg. Driver |
| Driver | # | Start | Pos. | Finish | Diff. | W | 5 | 10 | 15 | 20 | Led | Laps | Comp. | Rating |
| Alex Bowman | 3 | 11.3 | 17.3 | 22 | -10.7 | 0 | 0 | 0 | 1 | 2 | 0 | 5 | 1090 | 70.6 |
| Erik Jones | 3 | 21 | 21.7 | 24.3 | -3.3 | 0 | 0 | 0 | 1 | 1 | 0 | 9 | 1195 | 61.3 |
| Chris Buescher | 3 | 13.7 | 18 | 19.7 | -6 | 0 | 0 | 0 | 0 | 1 | 0 | 2 | 1209 | 62.5 |
| Daniel Hemric | 3 | 18.7 | 21.7 | 21.3 | -2.6 | 0 | 0 | 0 | 0 | 2 | 4 | 37 | 1206 | 56.3 |
| Bubba Wallace | 3 | 22.7 | 23 | 22 | 0.7 | 0 | 0 | 0 | 0 | 1 | 0 | 0 | 1207 | 53.2 |
| Ryan Preece | 3 | 17.3 | 23.7 | 23.3 | -6 | 0 | 0 | 0 | 0 | 2 | 0 | 1 | 1128 | 52.1 |
| Matt DiBenedetto | 3 | 22 | 20.7 | 24 | -2 | 0 | 0 | 0 | 0 | 1 | 0 | 8 | 1206 | 56.5 |
| Matt Tifft | 3 | 32.3 | 28 | 26 | 6.3 | 0 | 0 | 0 | 0 | 1 | 0 | 13 | 1200 | 39.4 |
| David Ragan | 3 | 23 | 26.3 | 26.3 | -3.3 | 0 | 0 | 0 | 0 | 0 | 0 | 0 | 1202 | 44.5 |
| Corey LaJoie | 3 | 25.7 | 29.3 | 28.3 | -2.6 | 0 | 0 | 0 | 0 | 0 | 0 | 5 | 1195 | 36.7 |
| | | Avg. | Run | Avg. | Pos. | | Top | Top | Top | Top | Laps | Fast | Laps | Avg. Driver |
| Driver | # | Start | Pos. | Finish | Diff. | W | 5 | 10 | 15 | 20 | Led | Laps | Comp. | Rating |
| Ross Chastain | 3 | 30.7 | 31.7 | 30.3 | 0.4 | 0 | 0 | 0 | 0 | 0 | 0 | 40 | 1067 | 37 |
| Bayley Currey | 2 | 31 | 33 | 31.5 | -0.5 | 0 | 0 | 0 | 0 | 0 | 0 | 0 | 693 | 28.4 |
| DJ Kennington | 1 | 35 | 32 | 32 | 3 | 0 | 0 | 0 | 0 | 0 | 0 | 2 | 489 | 29.2 |
| Quin Houff | 2 | 31.5 | 34 | 32 | -0.5 | 0 | 0 | 0 | 0 | 0 | 0 | 1 | 688 | 27 |
| Landon Cassill | 3 | 28 | 31.3 | 32 | -4 | 0 | 0 | 0 | 0 | 0 | 0 | 12 | 1083 | 35.5 |
| Joey Gase | 1 | 37 | 34 | 33 | 4 | 0 | 0 | 0 | 0 | 0 | 0 | 3 | 387 | 27.2 |
| Jeb Burton | 2 | 31.5 | 33.5 | 33 | -1.5 | 0 | 0 | 0 | 0 | 0 | 0 | 0 | 555 | 28.9 |
| Cody Ware | 2 | 33.5 | 35 | 34 | -0.5 | 0 | 0 | 0 | 0 | 0 | 0 | 0 | 355 | 25.9 |
| Michael McDowell | 3 | 22.7 | 31.3 | 34.3 | -11.6 | 0 | 0 | 0 | 0 | 0 | 0 | 1 | 888 | 36.2 |
Team
| Team Momentum |
| | | Avg. | Run | Avg. | Pos. | | Top | Top | Top | Top | Laps | Fast |
| Team | # | Start | Pos. | Finish | Diff. | W | 5 | 10 | 15 | 20 | Led | Laps |
| Chip Ganassi Racing | 6 | 14.0 | 14.9 | 15.2 | -1.2 | 0 | 0 | 2 | 4 | 5 | 0 | 12 |
| Front Row Motorsports | 9 | 26.0 | 28.5 | 28.9 | -2.9 | 0 | 0 | 0 | 0 | 1 | 0 | 14 |
| Hendrick Motorsports | 12 | 15.8 | 15.4 | 16.7 | -0.9 | 0 | 1 | 2 | 7 | 8 | 53 | 116 |
| Joe Gibbs Racing | 12 | 12.0 | 10.4 | 9.3 | 2.8 | 2 | 7 | 9 | 10 | 10 | 471 | 310 |
| JTG Daugherty Racing | 6 | 15.5 | 20.9 | 21.5 | -6.0 | 0 | 0 | 0 | 0 | 3 | 0 | 3 |
| Richard Childress Racing | 6 | 17.4 | 16.4 | 17.0 | 0.4 | 0 | 0 | 1 | 2 | 4 | 4 | 73 |
| Roush Fenway Racing | 6 | 19.4 | 17.7 | 16.4 | 3.0 | 0 | 0 | 1 | 3 | 4 | 0 | 8 |
| Stewart-Haas Racing | 12 | 15.0 | 10.7 | 10.6 | 4.4 | 0 | 3 | 8 | 9 | 10 | 56 | 222 |
| Team Penske | 9 | 8.0 | 9.5 | 10.0 | -2.0 | 1 | 4 | 6 | 6 | 8 | 628 | 213 |
Draftkings Scoring Averages
| Driver | 2018 | 2017 | 2016 | 2015 | 2014 | Last 2 Avg | Last 5 Avg | DK Seas. Avg. |
| Kyle Busch | 66 | 70.25 | 89.75 | 93.5 | 69.5 | 68.13 | 77.80 | 65.4 |
| Martin Truex Jr | 74.25 | 111.25 | 66.75 | 40 | 29 | 92.75 | 64.25 | 52.48 |
| Kevin Harvick | 80.5 | 49 | 58.5 | 92.75 | 7 | 64.75 | 57.55 | 47.64 |
| Brad Keselowski | -12.5 | 40 | 31.75 | 106 | 133 | 13.75 | 59.65 | 49.38 |
| Joey Logano | 45 | -12.5 | 44 | 42 | -28.75 | 16.25 | 17.95 | 53.1 |
| Chase Elliott | 58.25 | 33.5 | -13 | | | 45.88 | 26.25 | 45.36 |
| Denny Hamlin | 25 | 79 | 43.25 | 24 | 45 | 52.00 | 43.25 | 38.55 |
| Kyle Larson | 41 | 98.25 | 27 | -1 | 61 | 69.63 | 45.25 | 36.57 |
| Kurt Busch | 82 | 38 | 6.5 | 35 | 28.25 | 60.00 | 37.95 | 44.5 |
| Erik Jones | 20 | -28 | | | | -4.00 | -4.00 | 33.86 |
| Alex Bowman | 30 | | 12 | 1.5 | 21 | 30.00 | 16.13 | 38.54 |
| Ryan Blaney | 41 | 21 | 36 | 21 | | 31.00 | 29.75 | 37.92 |
| Driver | 2018 | 2017 | 2016 | 2015 | 2014 | Last 2 Avg | Last 5 Avg | DK Seas. Avg. |
| Clint Bowyer | -9.5 | 49.5 | 28 | -5.5 | 55 | 20.00 | 23.50 | 30.75 |
| Aric Almirola | 81.5 | 17.5 | 32 | 43 | 18.5 | 49.50 | 38.50 | 34.31 |
| Jimmie Johnson | 47.5 | 27.5 | 22.25 | 7 | -37.5 | 37.50 | 13.35 | 31.12 |
| Daniel Suarez | 9.5 | 48 | | | | 28.75 | 28.75 | 36.52 |
| Ryan Newman | 50 | 15.5 | 55 | 48 | 63 | 32.75 | 46.30 | 35.17 |
| William Byron | 27 | | | | | 27.00 | 27.00 | 28.5 |
| Ricky Stenhouse Jr | 10.25 | 34.5 | 46 | 42.5 | 48.5 | 22.38 | 36.35 | 26.79 |
| Chris Buescher | 28 | 16 | 22 | | | 22.00 | 22.00 | 29.85 |
| Austin Dillon | 24 | 40 | 33.5 | 52 | 39.5 | 32.00 | 37.80 | 21.4 |
| Paul Menard | 22 | 29 | 32 | 22.5 | 22.5 | 25.50 | 25.60 | 28.19 |
| Matt DiBenedetto | 16 | 0.5 | -2 | 9 | | 8.25 | 5.88 | 24.88 |
| Daniel Hemric | | | | | | | | 19.28 |
| Driver | 2018 | 2017 | 2016 | 2015 | 2014 | Last 2 Avg | Last 5 Avg | DK Seas. Avg. |
| Ty Dillon | 23 | 37 | | | | 30.00 | 30.00 | 25.56 |
| Ryan Preece | | | | | | | | 23.78 |
| Michael McDowell | 21 | 12 | -6 | | | 16.50 | 9.00 | 14.38 |
| Bubba Wallace | 23 | | | | | 23.00 | 23.00 | 18.89 |
| David Ragan | 16 | 18 | 10.5 | 11.5 | 20 | 17.00 | 15.20 | 18.64 |
| Corey LaJoie | 23 | 13 | | | | 18.00 | 18.00 | 22 |
| Ross Chastain | 26 | | | | | 26.00 | 26.00 | 21.66 |
| Matt Tifft | | | | | | | | 19.79 |
| Landon Cassill | 4 | 26 | 18 | -3 | 10 | 15.00 | 11.00 | 15.66 |
| Quin Houff | | | | | | | | 15.04 |
| Reed Sorenson | | 11 | 10 | | 16 | 11.00 | 12.33 | 16.35 |
| Austin Theriault | | | | | | | | 0 |
| Andy Seuss | | | | | | | | 0 |
FanDuel Scoring Averages
| Driver | 2018 | 2017 | 2016 | 2015 | 2014 | Last 2 Avg | Last 5 Avg | FD Seas. Avg. |
| Kyle Busch | 74.2 | 66.1 | 73.4 | 84.2 | 76.2 | 70.15 | 74.82 | 64.52 |
| Martin Truex Jr | 74.4 | 80.8 | 60.9 | 60.6 | 58 | 77.60 | 66.94 | 58.91 |
| Kevin Harvick | 80.8 | 69.6 | 69.1 | 78.5 | 32.4 | 75.20 | 66.08 | 54.48 |
| Brad Keselowski | 25.3 | 62.6 | 53.2 | 84.1 | 90.3 | 43.95 | 63.10 | 56.27 |
| Joey Logano | 67.1 | 18.9 | 69.6 | 67.3 | 5.4 | 43.00 | 45.66 | 61.97 |
| Chase Elliott | 70.9 | 60.1 | 22.9 | | | 65.50 | 51.30 | 55.58 |
| Denny Hamlin | 53.6 | 82 | 60.6 | 52.6 | 63 | 67.80 | 62.36 | 55.01 |
| Kyle Larson | 63.1 | 88.7 | 54.1 | 32.9 | 74.9 | 75.90 | 62.74 | 49.89 |
| Kurt Busch | 69 | 63.6 | 40.1 | 59.1 | 55.1 | 66.30 | 57.38 | 60.30 |
| Erik Jones | 50.6 | -10.5 | | | | 20.05 | 20.05 | 50.04 |
| Alex Bowman | 58.6 | | 42.1 | 23 | 42.8 | 58.60 | 41.63 | 53.73 |
| Ryan Blaney | 63.1 | 50.1 | 61.6 | 44.5 | | 56.60 | 54.83 | 50.95 |
| Driver | 2018 | 2017 | 2016 | 2015 | 2014 | Last 2 Avg | Last 5 Avg | FD Seas. Avg. |
| Clint Bowyer | 21.5 | 70.1 | 51.1 | 28.7 | 70.1 | 45.80 | 48.30 | 48.22 |
| Aric Almirola | 77.3 | 45.6 | 55.6 | 63.1 | 46.5 | 61.45 | 57.62 | 51.75 |
| Jimmie Johnson | 66.6 | 57.1 | 53.7 | 41.5 | -17.9 | 61.85 | 40.20 | 52.99 |
| Daniel Suarez | 42.5 | 69.1 | | | | 55.80 | 55.80 | 51.96 |
| Ryan Newman | 71.1 | 42.5 | 73.1 | 67.6 | 76 | 56.80 | 66.06 | 55.45 |
| William Byron | 55.6 | | | | | 55.60 | 55.60 | 50.14 |
| Ricky Stenhouse Jr | 38.2 | 58.6 | 67.1 | 61.6 | 69 | 48.40 | 58.90 | 48.82 |
| Chris Buescher | 53 | 44.5 | 44.9 | | | 48.75 | 47.47 | 50.82 |
| Austin Dillon | 48 | 61.6 | 59.1 | 71.1 | 62 | 54.80 | 60.36 | 43.52 |
| Paul Menard | 51.6 | 52.6 | 56.1 | 47.5 | 51 | 52.10 | 51.76 | 50.22 |
| Matt DiBenedetto | 42.8 | 33.9 | 32.4 | 35.6 | | 38.35 | 36.18 | 45.87 |
| Daniel Hemric | | | | | | | | 43.21 |
| Driver | 2018 | 2017 | 2016 | 2015 | 2014 | Last 2 Avg | Last 5 Avg | FD Seas. Avg. |
| Ty Dillon | 49 | 59.6 | | | | 54.30 | 54.30 | 48.43 |
| Ryan Preece | | | | | | | | 44.48 |
| Michael McDowell | 46.3 | 42 | 15.1 | | | 44.15 | 34.47 | 37.81 |
| Bubba Wallace | 48.4 | | | | | 48.40 | 48.40 | 41.50 |
| David Ragan | 42.3 | 43.5 | 37.4 | 45.6 | 47 | 42.90 | 43.16 | 41.29 |
| Corey LaJoie | 46.8 | 39.8 | | | | 43.30 | 43.30 | 43.43 |
| Ross Chastain | 49.3 | | | | | 49.30 | 49.30 | 39.40 |
| Matt Tifft | | | | | | | | 41.58 |
| Landon Cassill | 3.8 | 50.6 | 43.9 | 32.4 | 37.1 | 27.20 | 33.56 | 36.73 |
| Quin Houff | | | | | | | | 33.87 |
| Reed Sorenson | | 37.1 | 35.9 | | 40.2 | 37.10 | 37.73 | 35.65 |
| Austin Theriault | | | | | | | | |
| Andy Seuss | | | | | | | | |
Weekly Rankings (1=Best, 40=Worst)
Race History, NHMS History, Track Type History columns are based on average finish in those spans.
| Driver | DK$ | FD $ | Race History | DK Avg L2 | FD Avg L2 | DK Avg L5 | FD Avg L5 | NHMS History | Track Type History |
| Kyle Busch | $11,900 | $14,500 | 1 | 3 | 4 | 1 | 1 | 1 | 1 |
| Martin Truex Jr | $11,500 | $14,000 | 4 | 1 | 1 | 2 | 2 | 2 | 3 |
| Kevin Harvick | $11,100 | $12,500 | 2 | 4 | 3 | 4 | 3 | 7 | 2 |
| Brad Keselowski | $10,700 | $12,000 | 6 | 28 | 24 | 3 | 5 | 3 | 4 |
| Joey Logano | $10,300 | $13,000 | 16 | 26 | 26 | 23 | 22 | 8 | 7 |
| Chase Elliott | $10,000 | $10,700 | 14 | 8 | 7 | 16 | 17 | 13 | 6 |
| Denny Hamlin | $9,700 | $11,500 | 3 | 6 | 5 | 7 | 7 | 6 | 5 |
| Kyle Larson | $9,400 | $10,400 | 7 | 2 | 2 | 6 | 6 | 4 | 12 |
| Kurt Busch | $9,200 | $11,000 | 7 | 5 | 6 | 9 | 11 | 15 | 14 |
| Erik Jones | $9,000 | $9,000 | 25 | 34 | 31 | 34 | 31 | 20 | 18 |
| Alex Bowman | $8,800 | $9,900 | 25 | 13 | 10 | 24 | 25 | 24 | 18 |
| Ryan Blaney | $8,600 | $10,000 | 12 | 12 | 12 | 13 | 14 | 11 | 16 |
| Driver | DK$ | FD $ | Race History | DK Avg L2 | FD Avg L2 | DK Avg L5 | FD Avg L5 | NHMS History | Track Type History |
| Clint Bowyer | $8,400 | $9,400 | 20 | 22 | 22 | 19 | 20 | 16 | 11 |
| Aric Almirola | $8,200 | $8,600 | 15 | 7 | 9 | 8 | 10 | 18 | 9 |
| Jimmie Johnson | $8,000 | $9,600 | 17 | 9 | 8 | 26 | 26 | 9 | 8 |
| Daniel Suarez | $7,800 | $8,400 | 9 | 15 | 13 | 14 | 12 | 5 | 13 |
| Ryan Newman | $7,600 | $8,000 | 5 | 10 | 11 | 5 | 4 | 9 | 9 |
| William Byron | $7,400 | $8,200 | 9 | 16 | 14 | 15 | 13 | 12 | 20 |
| Ricky Stenhouse Jr | $7,200 | $7,600 | 13 | 20 | 20 | 11 | 9 | 17 | 17 |
| Chris Buescher | $7,100 | $7,000 | 22 | 21 | 19 | 21 | 21 | 22 | 24 |
| Austin Dillon | $6,900 | $7,300 | 11 | 11 | 15 | 10 | 8 | 14 | 15 |
| Paul Menard | $6,800 | $6,500 | 19 | 18 | 17 | 18 | 16 | 19 | 22 |
| Matt DiBenedetto | $6,600 | $5,500 | 30 | 30 | 28 | 30 | 28 | 27 | 31 |
| Daniel Hemric | $6,400 | $6,000 | 40 | 31 | 32 | 31 | 32 | 40 | 25 |
| Driver | DK$ | FD $ | Race History | DK Avg L2 | FD Avg L2 | DK Avg L5 | FD Avg L5 | NHMS History | Track Type History |
| Ty Dillon | $6,200 | $5,000 | 18 | 13 | 16 | 12 | 15 | 20 | 21 |
| Ryan Preece | $6,000 | $5,000 | 40 | 31 | 32 | 31 | 32 | 30 | 23 |
| Michael McDowell | $5,900 | $4,500 | 28 | 25 | 23 | 29 | 29 | 25 | 28 |
| Bubba Wallace | $5,700 | $4,000 | 21 | 19 | 20 | 20 | 19 | 40 | 26 |
| David Ragan | $5,600 | $4,000 | 24 | 24 | 27 | 25 | 24 | 27 | 29 |
| Corey LaJoie | $5,500 | $4,000 | 27 | 23 | 25 | 22 | 23 | 29 | 33 |
| Ross Chastain | $5,400 | $3,000 | 23 | 17 | 18 | 17 | 18 | 22 | 30 |
| Matt Tifft | $5,300 | $3,500 | 40 | 31 | 32 | 31 | 32 | 40 | 27 |
| Landon Cassill | $5,200 | $3,000 | 29 | 27 | 30 | 28 | 30 | 26 | 32 |
| Quin Houff | $5,100 | $2,500 | 40 | 31 | 32 | 31 | 32 | 40 | 34 |
| Reed Sorenson | $5,000 | $2,500 | 31 | 29 | 29 | 27 | 27 | 31 | 35 |
| Austin Theriault | $4,900 | #N/A | 40 | 31 | 32 | 31 | 32 | 40 | 40 |
| Andy Seuss | $4,800 | #N/A | 40 | 31 | 32 | 31 | 32 | 40 | 40 |