
We’re nearly halfway through the regular season at the Cup level and thus the All-Star Race is upon this Saturday night in Charlotte. The All-Star race is a different kind of race, firstly in that, it’s an exhibition race, but secondly in its length and format. Now it being an exhibition race means that there are no points or stage wins or overall race wins on the line here for the Cup standings, but there is a million-dollar payday at the end of it for the winner. Also, because it’s an exhibition race, the field is about half the size of a normal Cup race including the race next weekend, the Coca-Cola 600.
For starters, the track is a 1.5-mile Quad-oval in which there are two turns on the front straightaway. The four turns are banked at 24 degrees from the apron to the outer wall. Ordinarily, this track holds a fair amount of speed throughout the run as it’s a fairly smooth racing surface and the fairly generous banking allows for momentum to hold throughout a lap. Keep in mind that this is where this 2019 aero package debuted last year in this race and it got such rave reviews that NASCAR kept in place for Cup races. This year, however, the package on the cars will be different in this race yet again as they will test drive the 2021 Gen 7 car package involving a carbon fiber splitter and a radiator duct that will exit through the hood as opposed to where it currently exits into the engine compartment.
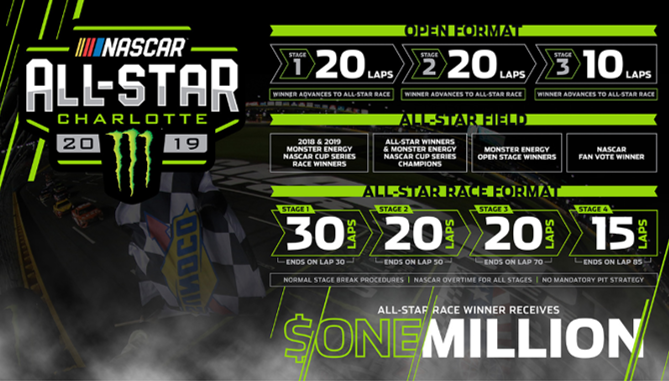 Turning to the field and the format of the race for a minute, there are only 15 drivers locked into the race as of this writing on Thursday. If a driver has won a points race in the last two seasons (2018 and 2019) they are locked in, if they have won an All-Star race previously, they are locked in, if they are a past Cup Series champion, they are locked in. There are as many as four more drivers that can be in the field as well which will be announced on Saturday in a winner of the fan vote and the winners of the three stages in the Monster Energy Open, a 50-lap race that happens two hours prior to the All-Star race, get added to the field as well for a total of 19 total drivers for the 85-lap All-Star race.
The All-Star Race itself is broken into four stages of 30 laps, 20 laps, 20 laps, and 15 laps with green and yellow flag laps counting in the first three stages and only green flag laps counting in the fourth as well as unlimited overtime changes in the fourth stage. Cars will need to pit at least once to finish the race however there are no pit stop requirements in terms of the number of tires in this exhibition race.
Track Data
Salaries
| DK | DK Points | FD | FD Points | ||
| Name | Salary | Per Race | Salary | Per Race | Status |
| Kyle Busch | $10,500 | 66.21 | $14,000 | 67.86 | |
| Chase Elliott | $10,100 | 52.12 | $10,500 | 63.92 | |
| Kevin Harvick | $9,800 | 50.57 | $13,000 | 59.21 | |
| Martin Truex Jr | $9,500 | 53.55 | $12,000 | 63.88 | |
| Joey Logano | $9,300 | 52.77 | $12,500 | 65.77 | |
| Brad Keselowski | $9,000 | 53.59 | $11,500 | 62.84 | |
| Kurt Busch | $8,700 | 48.62 | $9,000 | 66.26 | |
| Denny Hamlin | $8,400 | 39.38 | $10,000 | 59.46 | |
| Ryan Blaney | $8,100 | 36.55 | $8,500 | 53.13 | |
| Kyle Larson | $7,800 | 33.7 | Q | ||
| DK | DK Points | FD | FD Points | ||
| Name | Salary | Per Race | Salary | Per Race | Status |
| Aric Almirola | $7,500 | 35.38 | $7,500 | 53.47 | |
| Clint Bowyer | $7,200 | 37.89 | $9,500 | 57.25 | |
| Daniel Suarez | $6,900 | 39.18 | Q | ||
| Erik Jones | $6,700 | 35.36 | $6,000 | 56.19 | |
| Jimmie Johnson | $6,500 | 32.96 | $7,000 | 56.40 | |
| Alex Bowman | $6,300 | 33.16 | Q | ||
| Chris Buescher | $6,200 | 26.54 | Q | ||
| Ty Dillon | $6,100 | 27.44 | Q | ||
| William Byron | $6,000 | 26.98 | Q | ||
| DK | DK Points | FD | FD Points | ||
| Name | Salary | Per Race | Salary | Per Race | Status |
| Ryan Preece | $5,900 | 25.54 | Q | ||
| Austin Dillon | $5,800 | 29.39 | $5,500 | 53.86 | |
| Ryan Newman | $5,600 | 33.46 | $5,000 | 56.50 | |
| Ricky Stenhouse Jr | $5,500 | 24.77 | Q | ||
| Paul Menard | $5,400 | 27.48 | Q | ||
| Matt DiBenedetto | $5,300 | 22.12 | Q | ||
| Daniel Hemric | $5,200 | 17.06 | Q |
Last 10 All-Star Races
| Driver | Best Fin. | Wins | Races | Avg. Fin. | ’09 | ’10 | ’11 | ’12 | ’13 | ’14 | ’15 | ’16 | ’17 | ’18 |
|---|---|---|---|---|---|---|---|---|---|---|---|---|---|---|
| Chase Elliott | 5 | 0 | 3 | 6 | – | – | – | – | – | – | – | 6 | 7 | 5 |
| Joey Logano | 1 | 1 | 8 | 6.9 | 8 | 3 | – | – | 2 | 22 | 8 | 1 | 8 | 3 |
| Kevin Harvick | 1 | 1 | 10 | 6.9 | 15 | 6 | 9 | 6 | 11 | 2 | 2 | 11 | 6 | 1 |
| Kurt Busch | 1 | 1 | 10 | 7.1 | 3 | 1 | 13 | 8 | 5 | 11 | 3 | 5 | 4 | 18 |
| Denny Hamlin | 1 | 1 | 10 | 7.4 | 4 | 4 | 7 | 20 | 6 | 9 | 1 | 9 | 10 | 4 |
| Kyle Busch | 1 | 1 | 10 | 7.7 | 7 | 14 | 2 | 4 | 3 | 21 | 6 | 10 | 1 | 9 |
| Jimmie Johnson | 1 | 2 | 10 | 8.1 | 13 | 13 | 11 | 1 | 1 | 6 | 15 | 12 | 3 | 6 |
| Kyle Larson | 2 | 0 | 3 | 8.3 | – | – | – | – | – | – | – | 16 | 2 | 7 |
| Daniel Suarez | 2 | 0 | 2 | 8.5 | – | – | – | – | – | – | – | – | 15 | 2 |
| Brad Keselowski | 2 | 0 | 10 | 11.6 | 17 | 7 | 18 | 2 | 22 | 10 | 9 | 2 | 9 | 20 |
| Austin Dillion | 12 | 0 | 1 | 12 | – | – | – | – | – | – | – | – | – | 12 |
| Driver | Best Fin. | Wins | Races | Avg. Fin. | ’09 | ’10 | ’11 | ’12 | ’13 | ’14 | ’15 | ’16 | ’17 | ’18 |
| Martin Truex Jr. | 2 | 0 | 5 | 12.6 | – | 2 | – | – | – | 18 | – | 14 | 12 | 17 |
| Ryan Blaney | 11 | 0 | 2 | 13 | – | – | – | – | – | – | – | – | 11 | 15 |
| Ricky Stenhouse Jr. | 11 | 0 | 3 | 13.7 | – | – | – | – | 16 | – | – | – | 14 | 11 |
| Clint Bowyer | 7 | 0 | 8 | 13.9 | 12 | – | 16 | 14 | 18 | 7 | 12 | – | 13 | 19 |
| Aric Almirola | 14 | 0 | 1 | 14 | – | – | – | – | – | – | 14 | – | – | – |
| Ryan Newman | 10 | 0 | 10 | 14.4 | 18 | 11 | 10 | 10 | 13 | 16 | 18 | 13 | 19 | 16 |
| David Ragan | 8 | 0 | 4 | 14.5 | – | – | 8 | 18 | 19 | 13 | – | – | – | – |
| Paul Menard | 16 | 0 | 1 | 16 | – | – | – | 16 | – | – | – | – | – | – |
| Chris Buescher | 17 | 0 | 1 | 17 | – | – | – | – | – | – | – | – | 17 | – |
| Alex Bowman | 21 | 0 | 1 | 21 | – | – | – | – | – | – | – | – | – | 21 |
All-Star Race History
| Avg. | Avg. | Pos. | Top | Top | Laps | Laps | Lead Lap | |||
| Driver | Races | Start | Finish | Diff. | Win | 5 | 10 | Comp. | Led | Finish |
| Jimmie Johnson | 17 | 9.1 | 6.8 | 2.3 | 4 | 9 | 11 | 1550 | 237 | 16 |
| Kevin Harvick | 18 | 8.5 | 8.8 | -0.3 | 2 | 5 | 11 | 1470 | 124 | 15 |
| Kurt Busch | 17 | 8.7 | 9.7 | -1 | 1 | 8 | 10 | 1412 | 83 | 13 |
| Denny Hamlin | 12 | 11.8 | 9.5 | 2.3 | 1 | 4 | 9 | 1099 | 63 | 9 |
| Kyle Busch | 13 | 5.6 | 10.5 | -4.9 | 1 | 4 | 8 | 1049 | 256 | 8 |
| Joey Logano | 8 | 9.9 | 6.9 | 3 | 1 | 4 | 7 | 701 | 12 | 7 |
| Ryan Newman | 17 | 11.1 | 11.6 | -0.5 | 1 | 3 | 7 | 1509 | 111 | 12 |
| Jamie McMurray | 12 | 13.1 | 13.6 | -0.5 | 1 | 2 | 4 | 1041 | 31 | 8 |
| Brad Keselowski | 10 | 10.1 | 11.6 | -1.5 | 0 | 2 | 6 | 848 | 111 | 7 |
| Chase Elliott | 3 | 16 | 6 | 10 | 0 | 1 | 3 | 276 | 0 | 3 |
| Kyle Larson | 3 | 11.7 | 8.3 | 3.4 | 0 | 1 | 2 | 274 | 64 | 2 |
| Avg. | Avg. | Pos. | Top | Top | Laps | Laps | Lead Lap | |||
| Driver | Races | Start | Finish | Diff. | Win | 5 | 10 | Comp. | Led | Finish |
| Martin Truex Jr | 8 | 13 | 13.9 | -0.9 | 0 | 1 | 2 | 623 | 17 | 4 |
| Daniel Suarez | 2 | 19 | 8.5 | 10.5 | 0 | 1 | 1 | 153 | 0 | 1 |
| Clint Bowyer | 9 | 8.8 | 14.3 | -5.5 | 0 | 0 | 1 | 814 | 11 | 7 |
| David Ragan | 4 | 16.8 | 14.5 | 2.3 | 0 | 0 | 1 | 370 | 0 | 4 |
| Austin Dillon | 1 | 9 | 12 | -3 | 0 | 0 | 0 | 93 | 0 | 1 |
| Ryan Blaney | 2 | 12 | 13 | -1 | 0 | 0 | 0 | 153 | 1 | 1 |
| Ricky Stenhouse Jr | 3 | 13 | 13.7 | -0.7 | 0 | 0 | 0 | 243 | 5 | 2 |
| Aric Almirola | 1 | 8 | 14 | -6 | 0 | 0 | 0 | 110 | 0 | 1 |
| Paul Menard | 1 | 7 | 16 | -9 | 0 | 0 | 0 | 90 | 0 | 1 |
| Chris Buescher | 1 | 11 | 17 | -6 | 0 | 0 | 0 | 60 | 0 | 0 |
| Alex Bowman | 1 | 18 | 21 | -3 | 0 | 0 | 0 | 68 | 0 | 0 |
Monster Energy Open Segment Winners (2016-present)
| Year | Driver |
|---|---|
| 2018 | AJ Allmendinger (Segment 3) |
| 2018 | Daniel Suarez (Segment 2) |
| 2018 | Alex Bowman (Segment 1) |
| 2017 | Daniel Suarez (Segment 3) |
| 2017 | Ryan Blaney (Segment 2) |
| 2017 | Clint Bowyer (Segment 1) |
| 2016 | Kyle Larson (Segment 3) |
| 2016 | Greg Biffle (Segment 2) |
| 2016 | Trevor Bayne (Segment 1) |