
Welcome to the official start of the 2018 Monster Energy NASCAR Cup Series season. The Daytona 500 is here! The All-American race in all it’s glory and chaos happens Sunday afternoon on Fox and we have all the data you need for it right here.
This is not last year’s track breakdown, a new year means new stats and new metrics to help breakdown their performances that much more. If you have any questions about anything reach out in the forums or via Twitter @theselzman and also check out the Track Breakdown Legend for a full description of all the stats in all the tables.
Let’s get down to business.
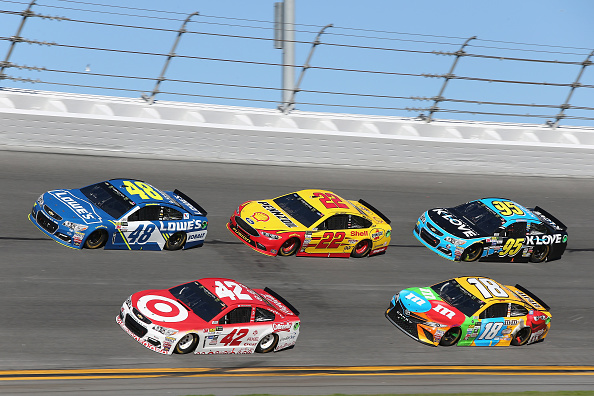
Daytona is a 2.5-mile superspeedway that hosts two races a year, this and the Coke Zero 400 in July. It is also one of only two tracks on the schedule that are restrictor plate tracks, trust me you will hear this term a lot this week. It essentially means that NASCAR has placed a plate in the engine that restricts the speeds of the cars to make them safer on the track. In reality this adjustment to the cars creates pack racing more than other tracks and makes cars much less stable aerodynamically leading to more crashes, including the well-known big ones. Over the last four Daytona 500s specifically there have been an average of seven non-stage related cautions for 34 laps a race run under yellow.
The plate racing also means that there are fewer times of single-file racing in these races and few chances for one particularly driver to dominant the laps led category like at the standard 1.5-mile tracks.
Aside from the new stats we have included, there are new drivers on new teams for this season and some prominent drivers aren’t returning at all in 2018. Matt Kenseth, Dale Earnhardt Jr., and Danica Patrick are all done with their NASCAR careers, though Danica will race in the 500 but nothing else. There is a youth movement in full effect with several key drivers 25 and younger including Kyle Larson, Erik Jones, Chase Elliott, Alex Bowman, William Byron, and Daniel Suarez all expecting to make big impacts this season. Chevy unveiled a new car which has so far looked to be equal to their competitors and also faster in some speed tests. There are new pit stop rules that limit to pit crews to just five over-the-wall members, down from six over the last several years, which will mean slower pit stops early in the season.
Overall the Daytona 500 provides an exciting and chaotic start to the season that can see anything happen. This is one of the tracks however that it pays to leave a fair amount of money on the table as the less expensive drivers who typically ride in the back of the pack, can provide big points totals as they move up after crashes.
Track Data
Last Four Daytona 500s (on mobile devices please scroll to the right)
| Avg | Avg | Avg | Top | Top | Top | Top | Laps | Fast | Top 15 | Pass | Avg. | High | Low | Pos | Laps Led | High to | Low to | |||
| Driver | Races | Start | Run Pos | Finish | Wins | 5s | 10s | 15s | 20s | Led | Laps | Rate | Diff | Rating | Rating | Rating | Diff | Pts/Race | Avg Rating | Avg Rating |
| Denny Hamlin | 4 | 15.3 | 10 | 6 | 1 | 3 | 3 | 3 | 4 | 115 | 9 | 78% | -15 | 105.6 | 139.1 | 59.6 | 9.3 | 7.19 | 33.5 | 46.0 |
| Joey Logano | 4 | 15 | 10 | 6 | 1 | 1 | 3 | 4 | 4 | 49 | 23 | 80% | -10 | 105.4 | 125.3 | 95.7 | 9.0 | 3.06 | 19.9 | 9.7 |
| Kurt Busch | 3 | 8 | 12 | 10.7 | 1 | 1 | 2 | 2 | 2 | 16 | 12 | 69% | 0 | 97.1 | 107.0 | 89.9 | -2.7 | 1.33 | 9.9 | 7.2 |
| Kevin Harvick | 4 | 15.8 | 13 | 10.3 | 0 | 2 | 2 | 3 | 3 | 50 | 15 | 70% | -7 | 99.7 | 116.3 | 85.1 | 5.5 | 3.13 | 16.6 | 14.6 |
| Jimmie Johnson | 4 | 21 | 14.3 | 15 | 0 | 2 | 2 | 2 | 3 | 79 | 14 | 65% | 13 | 89.3 | 104.9 | 71.5 | 6.0 | 4.94 | 15.6 | 17.8 |
| Martin Truex Jr | 4 | 18.8 | 19.3 | 16.5 | 0 | 1 | 2 | 3 | 3 | 5 | 16 | 53% | -8 | 80.6 | 114.4 | 27.3 | 2.3 | 0.31 | 33.8 | 53.3 |
| Brad Keselowski | 4 | 26 | 14.5 | 22.8 | 0 | 1 | 1 | 1 | 2 | 16 | 14 | 63% | 23 | 90.5 | 117.1 | 76.6 | 3.2 | 1.00 | 26.6 | 13.9 |
| Ryan Blaney | 3 | 18.3 | 15.7 | 20 | 0 | 1 | 1 | 1 | 2 | 2 | 18 | 60% | 0 | 80.3 | 106.2 | 52.2 | -1.7 | 0.17 | 25.9 | 28.1 |
| Kyle Busch | 3 | 20.7 | 15.7 | 20 | 0 | 1 | 1 | 1 | 2 | 56 | 8 | 59% | -10 | 95.2 | 117.2 | 67.9 | 0.7 | 4.67 | 22.0 | 27.3 |
| Paul Menard | 4 | 25.3 | 17.3 | 20 | 0 | 1 | 1 | 1 | 2 | 29 | 15 | 50% | 4 | 79.8 | 92.9 | 65.2 | 5.3 | 1.81 | 13.1 | 14.6 |
| Aric Almirola | 4 | 23.3 | 22.5 | 17.5 | 0 | 1 | 1 | 3 | 3 | 7 | 16 | 25% | 11 | 70.6 | 82.9 | 59.4 | 5.8 | 0.44 | 12.3 | 11.2 |
| AJ Allmendinger | 4 | 30.8 | 26.3 | 17.5 | 0 | 1 | 1 | 1 | 2 | 4 | 31 | 16% | 20 | 61.4 | 80.5 | 48.1 | 13.3 | 0.25 | 19.1 | 13.3 |
| Kasey Kahne | 4 | 14.3 | 15.5 | 15 | 0 | 0 | 2 | 3 | 3 | 9 | 8 | 62% | -1 | 81.6 | 104.5 | 64.1 | -0.7 | 0.56 | 22.9 | 17.5 |
| Austin Dillon | 4 | 15.5 | 17.3 | 12.8 | 0 | 0 | 2 | 3 | 4 | 9 | 19 | 51% | 0 | 76.7 | 83.4 | 73.4 | 2.7 | 0.56 | 6.7 | 3.3 |
| Kyle Larson | 4 | 18.8 | 22 | 22.8 | 0 | 0 | 1 | 2 | 2 | 16 | 16 | 43% | -1 | 72.1 | 101.2 | 32.2 | -4.0 | 1.00 | 29.1 | 39.9 |
| Trevor Bayne | 4 | 21.3 | 22.5 | 25.3 | 0 | 0 | 1 | 1 | 1 | 0 | 16 | 25% | -5 | 60.2 | 65.2 | 54.3 | -4.0 | 0.00 | 5.0 | 5.9 |
| Clint Bowyer | 4 | 16.5 | 25 | 28.5 | 0 | 0 | 1 | 1 | 1 | 0 | 16 | 25% | -5 | 57.4 | 88.4 | 41.0 | -12.0 | 0.00 | 31.0 | 16.4 |
| Ricky Stenhouse Jr | 4 | 27 | 22.3 | 22.3 | 0 | 0 | 1 | 1 | 1 | 0 | 19 | 24% | -7 | 69.3 | 74.0 | 59.0 | 4.7 | 0.00 | 4.7 | 10.3 |
| Matt DiBenedetto | 2 | 22.5 | 26.5 | 24.5 | 0 | 0 | 1 | 1 | 1 | 0 | 5 | 14% | 3 | 47.1 | 59.6 | 34.5 | -2.0 | 0.00 | 12.5 | 12.6 |
| Jamie McMurray | 4 | 11.5 | 16 | 21.5 | 0 | 0 | 0 | 1 | 2 | 13 | 20 | 64% | -10 | 80.7 | 87.3 | 73.8 | -10.0 | 0.81 | 6.6 | 6.9 |
| Chase Elliott | 2 | 1 | 22.5 | 25.5 | 0 | 0 | 0 | 1 | 1 | 42 | 12 | 46% | -10 | 68.4 | 93.1 | 43.7 | -24.5 | 5.25 | 24.7 | 24.7 |
| Michael McDowell | 3 | 28 | 19.7 | 20.3 | 0 | 0 | 0 | 2 | 2 | 0 | 18 | 37% | 6 | 68.9 | 71.5 | 64.8 | 7.7 | 0.00 | 2.6 | 4.1 |
| Ty Dillon | 3 | 20.3 | 21 | 27.7 | 0 | 0 | 0 | 0 | 0 | 0 | 9 | 27% | -2 | 62.8 | 72.0 | 57.4 | -7.4 | 0.00 | 9.2 | 5.4 |
| Brendan Gaughan | 1 | 39 | 19 | 11 | 0 | 0 | 0 | 1 | 1 | 0 | 5 | 23% | 23 | 63.4 | 63.4 | 63.4 | 28.0 | 0.00 | 0.0 | 0.0 |
| Danica Patrick | 4 | 18.8 | 22.5 | 32.3 | 0 | 0 | 0 | 0 | 0 | 2 | 6 | 22% | -5 | 60.6 | 69.6 | 50.9 | -13.5 | 0.13 | 9.0 | 9.7 |
| Ryan Newman | 4 | 23.3 | 24.3 | 23 | 0 | 0 | 0 | 1 | 1 | 1 | 18 | 21% | 6 | 55.9 | 61.7 | 43.2 | 0.3 | 0.06 | 5.8 | 12.7 |
| Chris Buescher | 2 | 27 | 26.5 | 37 | 0 | 0 | 0 | 0 | 0 | 0 | 4 | 19% | 6 | 51.7 | 66.7 | 36.6 | -10.0 | 0.00 | 15.0 | 15.1 |
| David Gilliland | 2 | 21.5 | 28 | 23.5 | 0 | 0 | 0 | 1 | 1 | 0 | 5 | 13% | -1 | 51.4 | 61.3 | 41.5 | -2.0 | 0.00 | 9.9 | 9.9 |
| Jeffrey Earnhardt | 1 | 32 | 28 | 26 | 0 | 0 | 0 | 0 | 0 | 0 | 0 | 7% | 3 | 33.0 | 33.0 | 33.0 | 6.0 | 0.00 | 0.0 | 0.0 |
| David Ragan | 4 | 30 | 30.3 | 26.3 | 0 | 0 | 0 | 0 | 1 | 1 | 7 | 7% | -6 | 48.0 | 68.8 | 32.2 | 3.7 | 0.06 | 20.8 | 15.8 |
| Alex Bowman | 1 | 29 | 31 | 23 | 0 | 0 | 0 | 0 | 0 | 0 | 4 | 2% | -8 | 43.7 | 43.7 | 43.7 | 6.0 | 0.00 | 0.0 | 0.0 |
| Daniel Suarez | 1 | 19 | 32 | 29 | 0 | 0 | 0 | 0 | 0 | 0 | 0 | 2% | -34 | 37.5 | 37.5 | 37.5 | -10.0 | 0.00 | 0.0 | 0.0 |
| Corey LaJoie | 1 | 31 | 32 | 24 | 0 | 0 | 0 | 0 | 0 | 0 | 2 | 0% | 5 | 36.1 | 36.1 | 36.1 | 7.0 | 0.00 | 0.0 | 0.0 |
| DJ Kennington | 1 | 28 | 29 | 36 | 0 | 0 | 0 | 0 | 0 | 0 | 0 | 0% | -2 | 32.5 | 32.5 | 32.5 | -8.0 | 0.00 | 0.0 | 0.0 |
| Erik Jones | 1 | 34 | 35 | 39 | 0 | 0 | 0 | 0 | 0 | 0 | 4 | 0% | 1 | 50.6 | 50.6 | 50.6 | -5.0 | 0.00 | 0.0 | 0.0 |
| Gray Gaulding | 0 | 0 | 0 | 0 | 0 | 0 | 0 | 0 | 0 | 0 | 0 | 0% | 0 | 0.0 | 0.0 | 0.0 | 0.0 | 0.00 | 0.0 | 0.0 |
| Mark Thompson | 0 | 0 | 0 | 0 | 0 | 0 | 0 | 0 | 0 | 0 | 0 | 0% | 0 | 0.0 | 0.0 | 0.0 | 0.0 | 0.00 | 0.0 | 0.0 |
| Justin Marks | 0 | 0 | 0 | 0 | 0 | 0 | 0 | 0 | 0 | 0 | 0 | 0% | 0 | 0.0 | 0.0 | 0.0 | 0.0 | 0.00 | 0.0 | 0.0 |
| William Byron | 0 | 0 | 0 | 0 | 0 | 0 | 0 | 0 | 0 | 0 | 0 | 0% | 0 | 0.0 | 0.0 | 0.0 | 0.0 | 0.00 | 0.0 | 0.0 |
| Darrell Wallace Jr. | 0 | 0 | 0 | 0 | 0 | 0 | 0 | 0 | 0 | 0 | 0 | 0% | 0 | 0.0 | 0.0 | 0.0 | 0.0 | 0.00 | 0.0 | 0.0 |
Top-15 Drivers at Last Eight Races at Daytona International Overall (on mobile devices please scroll to the right)
| Avg. | Avg. | Avg. | Top | Top | Top | Top | Laps | Fast | Top 15 | Pass | Avg. | High | Low | Pos. | Laps Led | Rating | |||
| Driver | Races | Start | Run Pos. | Finish | Wins | 5s | 10s | 15s | 20s | Led | Laps | Rate | Diff. | Rating | Rating | Rating | Diff. | Pts/Race | Range |
| Denny Hamlin | 8 | 20.0 | 10.8 | 9.3 | 1 | 4 | 5 | 5 | 7 | 148 | 14 | 75% | -9 | 97.5 | 139.1 | 59.6 | 10.7 | 4.63 | 79.5 |
| Kurt Busch | 7 | 16.7 | 12.7 | 13.0 | 1 | 3 | 4 | 4 | 4 | 52 | 22 | 67% | 22 | 92.7 | 120.8 | 75.9 | 3.7 | 1.86 | 44.9 |
| Joey Logano | 8 | 17.4 | 14.4 | 12.8 | 1 | 2 | 4 | 5 | 6 | 55 | 44 | 65% | 3 | 91.7 | 125.3 | 49.1 | 4.6 | 1.72 | 76.2 |
| Ricky Stenhouse Jr | 8 | 20.5 | 21.0 | 19.4 | 1 | 2 | 3 | 3 | 4 | 17 | 35 | 32% | 0 | 70.9 | 100.7 | 34.1 | 1.1 | 0.53 | 66.6 |
| Brad Keselowski | 8 | 21.3 | 15.3 | 21.3 | 1 | 2 | 2 | 2 | 4 | 166 | 23 | 58% | 19 | 88.7 | 132.4 | 54.8 | 0.0 | 5.19 | 77.6 |
| Aric Almirola | 7 | 22.6 | 19.9 | 17.1 | 1 | 2 | 2 | 5 | 5 | 21 | 25 | 37% | 5 | 74.4 | 111.4 | 58.9 | 5.5 | 0.75 | 52.5 |
| Jimmie Johnson | 8 | 15.1 | 15.8 | 18.9 | 0 | 3 | 3 | 4 | 5 | 118 | 22 | 61% | 12 | 85.4 | 111.6 | 48.3 | -3.8 | 3.69 | 63.3 |
| Kevin Harvick | 8 | 17.0 | 19.4 | 19.5 | 0 | 3 | 3 | 4 | 4 | 61 | 23 | 48% | -2 | 82.3 | 116.3 | 32.0 | -2.5 | 1.91 | 84.3 |
| Kyle Busch | 7 | 19.0 | 17.3 | 18.1 | 0 | 2 | 2 | 2 | 5 | 72 | 23 | 52% | -8 | 83.8 | 117.2 | 54.6 | 0.9 | 2.57 | 62.6 |
| Paul Menard | 8 | 22.1 | 17.1 | 18.9 | 0 | 2 | 2 | 2 | 5 | 29 | 24 | 51% | 2 | 79.6 | 92.9 | 65.2 | 3.2 | 0.91 | 27.7 |
| Austin Dillon | 8 | 14.0 | 18.0 | 13.3 | 0 | 1 | 5 | 6 | 7 | 17 | 30 | 50% | -5 | 76.6 | 90.7 | 43.1 | 0.7 | 0.53 | 47.6 |
| Clint Bowyer | 8 | 18.1 | 21.9 | 18.0 | 0 | 1 | 5 | 5 | 5 | 7 | 26 | 35% | -5 | 68.9 | 104.0 | 41.0 | 0.1 | 0.22 | 63.0 |
| Michael McDowell | 6 | 28.5 | 19.0 | 13.7 | 0 | 1 | 3 | 5 | 5 | 0 | 31 | 39% | 6 | 70.4 | 78.3 | 60.2 | 14.8 | 0.00 | 18.1 |
| Trevor Bayne | 8 | 17.8 | 21.6 | 21.8 | 0 | 1 | 3 | 3 | 3 | 2 | 23 | 32% | -1 | 64.3 | 85.8 | 33.8 | -4.0 | 0.06 | 52.0 |
| Martin Truex Jr | 8 | 19.1 | 21.0 | 22.8 | 0 | 1 | 2 | 4 | 4 | 6 | 21 | 41% | -8 | 72.5 | 114.4 | 27.3 | -3.7 | 0.19 | 87.1 |
Top-15 Drivers at Restrictor Plate Races (Since Feb. 2014) (on mobile devices please scroll to the right)
| Avg | Avg | Avg | Top | Top | Top | Top | Laps | Fast | Top 15 | Pass | Avg | High | Low | Pos | Laps Led | Rating | |||
| Driver | Races | Start | Run Pos | Finish | Wins | 5s | 10s | 15s | 20s | Led | Laps | Rate | Diff | Rating | Rating | Rating | Diff | Pts/Race | Range |
| Brad Keselowski | 16 | 14.5 | 14.6 | 17.6 | 4 | 6 | 7 | 7 | 9 | 353 | 50 | 63% | 8 | 91.8 | 132.4 | 32.6 | -3.1 | 5.52 | 99.8 |
| Joey Logano | 16 | 17.4 | 14.2 | 15.1 | 3 | 5 | 7 | 9 | 10 | 220 | 72 | 66% | 4 | 91.6 | 125.3 | 44.3 | 2.3 | 3.44 | 81.0 |
| Denny Hamlin | 16 | 18.7 | 12.7 | 11.9 | 2 | 6 | 9 | 10 | 13 | 235 | 37 | 69% | -10 | 94.6 | 139.1 | 59.6 | 6.8 | 3.67 | 79.5 |
| Ricky Stenhouse Jr | 15 | 16.9 | 19.3 | 16.5 | 2 | 4 | 7 | 7 | 9 | 46 | 70 | 39% | 3 | 74.0 | 100.7 | 34.1 | 0.4 | 0.77 | 66.6 |
| Kurt Busch | 15 | 14.7 | 12.7 | 13.1 | 1 | 4 | 9 | 10 | 10 | 57 | 42 | 69% | 22 | 91.6 | 120.8 | 75.9 | 1.6 | 0.95 | 44.9 |
| Aric Almirola | 15 | 22.7 | 20.9 | 16.5 | 1 | 4 | 5 | 10 | 11 | 22 | 48 | 33% | 2 | 71.1 | 111.4 | 56.3 | 6.2 | 0.37 | 55.1 |
| Jimmie Johnson | 16 | 13.2 | 12.8 | 18.4 | 0 | 4 | 5 | 6 | 8 | 291 | 39 | 69% | 9 | 90.7 | 118.5 | 48.3 | -5.2 | 4.55 | 70.2 |
| Kyle Busch | 14 | 19.0 | 17.5 | 18.0 | 0 | 4 | 4 | 6 | 9 | 150 | 44 | 54% | 2 | 83.8 | 117.2 | 31.1 | 1.0 | 2.68 | 86.1 |
| Clint Bowyer | 16 | 21.1 | 22.2 | 16.4 | 0 | 3 | 9 | 10 | 11 | 19 | 78 | 35% | -2 | 70.6 | 104.0 | 41.0 | 4.7 | 0.30 | 63.0 |
| Kevin Harvick | 16 | 18.3 | 16.1 | 16.3 | 0 | 3 | 7 | 10 | 11 | 107 | 46 | 56% | 3 | 86.9 | 116.3 | 32.0 | 2.0 | 1.67 | 84.3 |
| Paul Menard | 16 | 16.8 | 16.4 | 16.4 | 0 | 3 | 6 | 8 | 11 | 42 | 62 | 53% | 2 | 79.7 | 97.9 | 53.2 | 0.4 | 0.66 | 44.7 |
| Ryan Newman | 16 | 19.4 | 26.2 | 16.1 | 0 | 3 | 5 | 8 | 10 | 20 | 69 | 13% | -1 | 57.4 | 76.8 | 43.2 | 3.3 | 0.31 | 33.6 |
| Austin Dillon | 16 | 14.6 | 19.6 | 16.3 | 0 | 2 | 7 | 11 | 12 | 18 | 71 | 40% | -4 | 73.7 | 90.7 | 43.1 | -1.7 | 0.28 | 47.6 |
| Trevor Bayne | 16 | 15.8 | 19.7 | 23.5 | 0 | 2 | 5 | 5 | 6 | 29 | 56 | 42% | -1 | 70.4 | 91.9 | 33.8 | -7.7 | 0.45 | 58.1 |
| Martin Truex Jr | 16 | 20.9 | 18.8 | 21.8 | 0 | 2 | 4 | 7 | 8 | 9 | 34 | 50% | -3 | 77.0 | 114.4 | 27.3 | -0.9 | 0.14 | 87.1 |
Point Changes at Daytona 500
| 17 Race | Season | DK Pts +/- | |
| Driver | DK Pts. | Avg DK Pts. | Season AVG |
| AJ Allmendinger | 79.5 | 23.30 | 56.20 |
| Aric Almirola | 53 | 28.74 | 24.26 |
| Austin Dillon | 19.75 | 27.60 | -7.85 |
| Brad Keselowski | -1.5 | 41.64 | -43.14 |
| Brendan Gaughan | 63.5 | 40.20 | 23.30 |
| Chase Elliott | 30.25 | 40.30 | -10.05 |
| Chris Buescher | 12.5 | 26.64 | -14.14 |
| Clint Bowyer | -12.5 | 28.28 | -40.78 |
| Corey LaJoie | 28 | 16.78 | 11.22 |
| Danica Patrick | -9.5 | 21.76 | -31.26 |
| Daniel Suarez | 5 | 28.62 | -23.62 |
| David Ragan | 14 | 24.04 | -10.04 |
| Denny Hamlin | 14.5 | 39.96 | -25.46 |
| Erik Jones | 2 | 28.86 | -26.86 |
| Jamie McMurray | -5.75 | 26.84 | -32.59 |
| Jeffrey Earnhardt | 24 | 14.28 | 9.72 |
| Jimmie Johnson | 5.25 | 34.15 | -28.90 |
| Joey Logano | 55.5 | 32.43 | 23.07 |
| Kasey Kahne | 59.25 | 24.98 | 34.27 |
| Kevin Harvick | 19 | 43.84 | -24.84 |
| Kurt Busch | 55.75 | 26.68 | 29.07 |
| Kyle Busch | -6 | 55.94 | -61.94 |
| Kyle Larson | 41.5 | 47.34 | -5.84 |
| Martin Truex Jr | 60.5 | 62.76 | -2.26 |
| Matt DiBenedetto | 53.5 | 18.93 | 34.57 |
| Michael McDowell | 37.5 | 24.85 | 12.65 |
| Paul Menard | 71 | 26.01 | 44.99 |
| Ricky Stenhouse Jr | 6 | 27.76 | -21.76 |
| Ryan Blaney | 82 | 25.54 | 56.46 |
| Ryan Newman | 17 | 30.92 | -13.92 |
| Trevor Bayne | 37.5 | 26.24 | 11.26 |
| Ty Dillon | 3.5 | 29.62 | -26.12 |
| Average +/- | 25.70 |
Top-10 and Bottom-10 Value Drivers
| Top 10 Value | Bottom 10 Value | ||||
| 1 | Brendan Gaughan | 7.73 | 32 | Jeffrey Earnhardt | 2.92 |
| 2 | Martin Truex Jr | 6.61 | 31 | Ryan Blaney | 2.97 |
| 3 | Kyle Busch | 5.59 | 30 | Kurt Busch | 3.07 |
| 4 | Kyle Larson | 5.09 | 29 | Ricky Stenhouse Jr | 3.12 |
| 5 | Ryan Newman | 4.69 | 28 | Jamie McMurray | 3.35 |
| 6 | Ty Dillon | 4.63 | 27 | Corey Lajoie | 3.36 |
| 7 | Kevin Harvick | 4.43 | 26 | Joey Logano | 3.38 |
| 8 | Chris Buescher | 4.37 | 25 | Erik Jones | 3.44 |
| 9 | Michael McDowell | 4.28 | 24 | Clint Bowyer | 3.45 |
| 10 | Denny Hamlin | 4.08 | 23 | Austin Dillon | 3.49 |
Drivers to watch this week
Denny Hamlin: Hamlin has arguably been the best driver over the last four Daytona 500s. He has a win, three top-fives, four top-20s, tied for the best average finish at 6.0 and has the highest average driver rating at 105.6 in that span. Hamlin has also led the most laps at 115, yet only has nine total fastest laps. In early practice (before qualifying and The Clash) he was very fast and qualified P2 for Sunday’s race. He does have a big range of driver ratings, so he could be a bit more hit and miss than others.
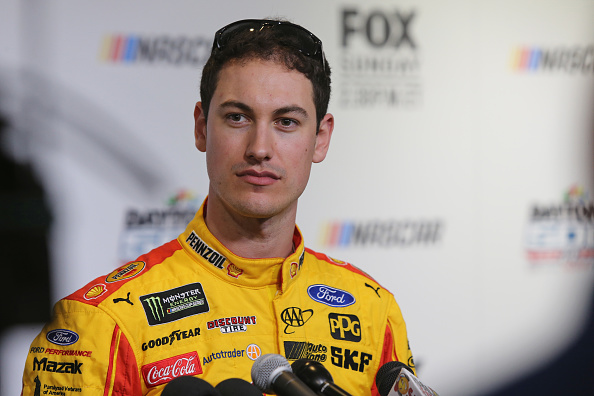
Joey Logano: If Hamlin is the best driver in the field in the 500, Logano is arguably second. His numbers are nearly identical to Hamlin’s across average start, finish, running order, wins, top 10s, top 20s, and top 15 rate. He does have fewer laps led but has 2.5 times the amount of fastest laps that Hamlin does. Logano is looking to start this season back on the right foot after a lackluster last 2/3 of 2017. Logano did have a monster start to last year that kicked off with a strong showing in the 500.
 Brad Keselowski: Keselowski is the best overall plate racer in the field this week with four wins over the last 16 races at both Daytona and Talladega. That being said, he has been lackluster at the last four 500s with just one top five and two top 20s in that stretch. He’s only led 16 laps and has run in the top-15 63% of the time. His price tag reflects the ability at restrictor plate races and his win in The Clash last weekend, but he is iffy at that price point for anything other than a GPP.
Alex Bowman: Bowman has had limited experiences in an MENCS car thus far but he takes over the 88-car with a team that knows how to setup a car for a restrictor plate track. Bowman finished qualifying on the pole, after a very good practice session and this makes the fourth time in the last five plate races that the 88 is on the pole regardless of driver. He showed what he can do when he drove the car at Phoenix in 2016 and now he has a very fast car at the front of the pack. His middle of the pack price tag makes him an intriguing option come Sunday.
A.J. Allmendinger: Allmendinger is a forgotten man most weeks as his experience and skills really only show through at road courses and really fast race tracks. This is one of those tracks. His positional differential is a nice +13.5 mark over the last four Daytona 500s and he has a top five and top 10 in that span. His price point of $5,900 puts him in the bottom tier of drivers, but his 79+ point showing last year in this race, could make him hard to pass up depending on where he qualifies.